 FEXLINK Research Institute
The short answer
NILM — non-intrusive load monitoring — means you do not put a sensor on every machine. You put one high-resolution sampling channel on the main meter and let the current and power waveform tell you which machine just started: detect a step in the power curve, extract the start-up transient, the steady-state power and the harmonic signature, then match that fingerprint against a library. The verdict up front: it is worth doing, but only in the right place. Large, clearly switching, strongly characterised loads — fans, pumps, air compressors — are recognised reliably. Small loads, continuously modulated loads and machines that start in groups are not. So do not roll it out everywhere. Pick one or two production lines, run a measured comparison, and count how many machines you can resolve and how much energy they represent before you decide whether to scale it or keep it as a screening tool.
1. What one meter can see
The approach was formalised by Hart in the early 1990s: replace "a meter per machine" with "high-resolution sampling on one meter, plus an algorithm that separates the mixture". Separation runs in four steps.
Sampling. The meter records active and reactive power at a fixed interval. Minute-level data only shows the total power staircase; sub-second sampling is what captures the inrush and harmonic shift at start-up.
Event detection. A step in the power curve is a switching event; the detector looks for its size, direction and duration.
Feature extraction. Each event yields three features: the start-up transient, the steady-state power, and the harmonic and power-factor signature.
Matching. The feature vector is compared with a library of fingerprints, built from on-site labelling or transferred from similar equipment.
Step one sets the ceiling: if the event was never recorded, no algorithm recovers it.
2. Three handles and one precondition
Start-up transient. A motor draws several times rated current at start, decaying with a characteristic time constant; a resistive load barely draws inrush. This separates motors from heating and lighting.
The active–reactive pair. Two loads may both draw 15 kW, but a motor at 0.85 power factor and a resistance furnace near unity sit in different places on the P–Q plane — the most stable single dimension NILM has.
Harmonics and waveform shape. Drives, switch-mode supplies and LED drivers each shape the current differently; only high-resolution sampling can use this.
Above the three sits a precondition: the machine must be individually visible at the main meter — its power step large enough against the total, its switching not coincident with something else, its duty reasonably stable rather than continuously modulated. Miss one and the features blur.
3. What it can and cannot identify
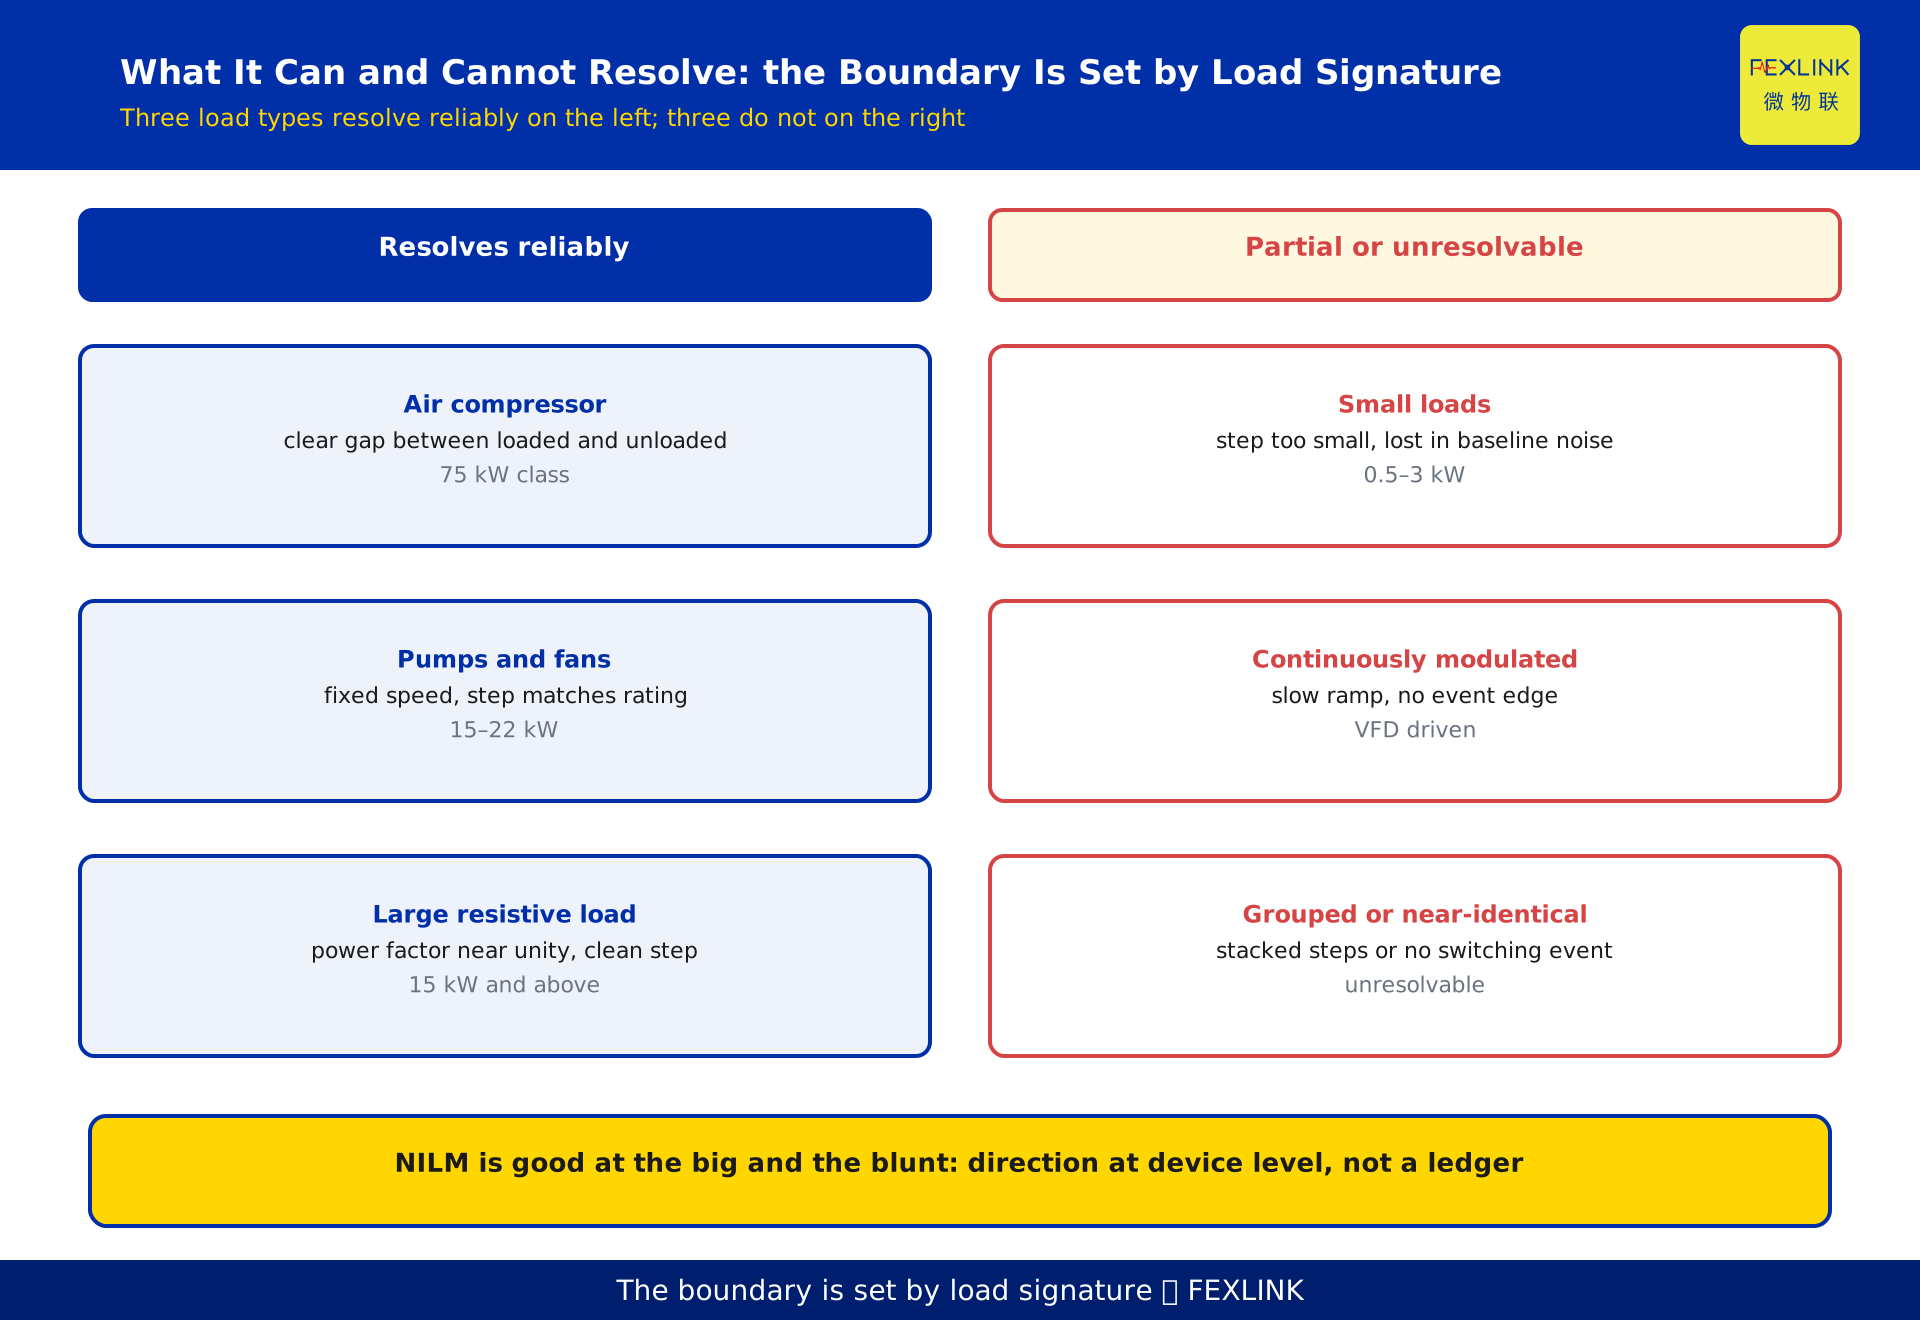
What it identifies well shares four properties: above ten kilowatts, two-state operation, single switching, stable duty.
- Air compressors. A clear gap between loaded and unloaded power makes them among the easiest to resolve.
- Pumps and fans. At fixed speed, start and stop are clean and the step matches rated power.
- Large resistive loads such as drying and heating: power factor near unity, a clean step.
What it struggles with shares its own pattern.
- Small loads of a few hundred watts: the step is too small against the total and vanishes into baseline noise.
- Continuously modulated loads: inverter-driven pumps and fans, dimmed lighting. Power ramps rather than steps, and event detection finds no clean edge.
- Grouped or near-identical switching: identical machines starting together stack into one step and are reported as a group; two 15 kW fans have near-identical signatures and separate only by schedule.
- Loads that never switch off: with no event, they exist only as baseline.
In one line: NILM is good at the big and the blunt — direction at device level, not a device-level ledger.
4. Against per-circuit metering: three granularities, three bills
Three routes reach device-level data, buying different things.
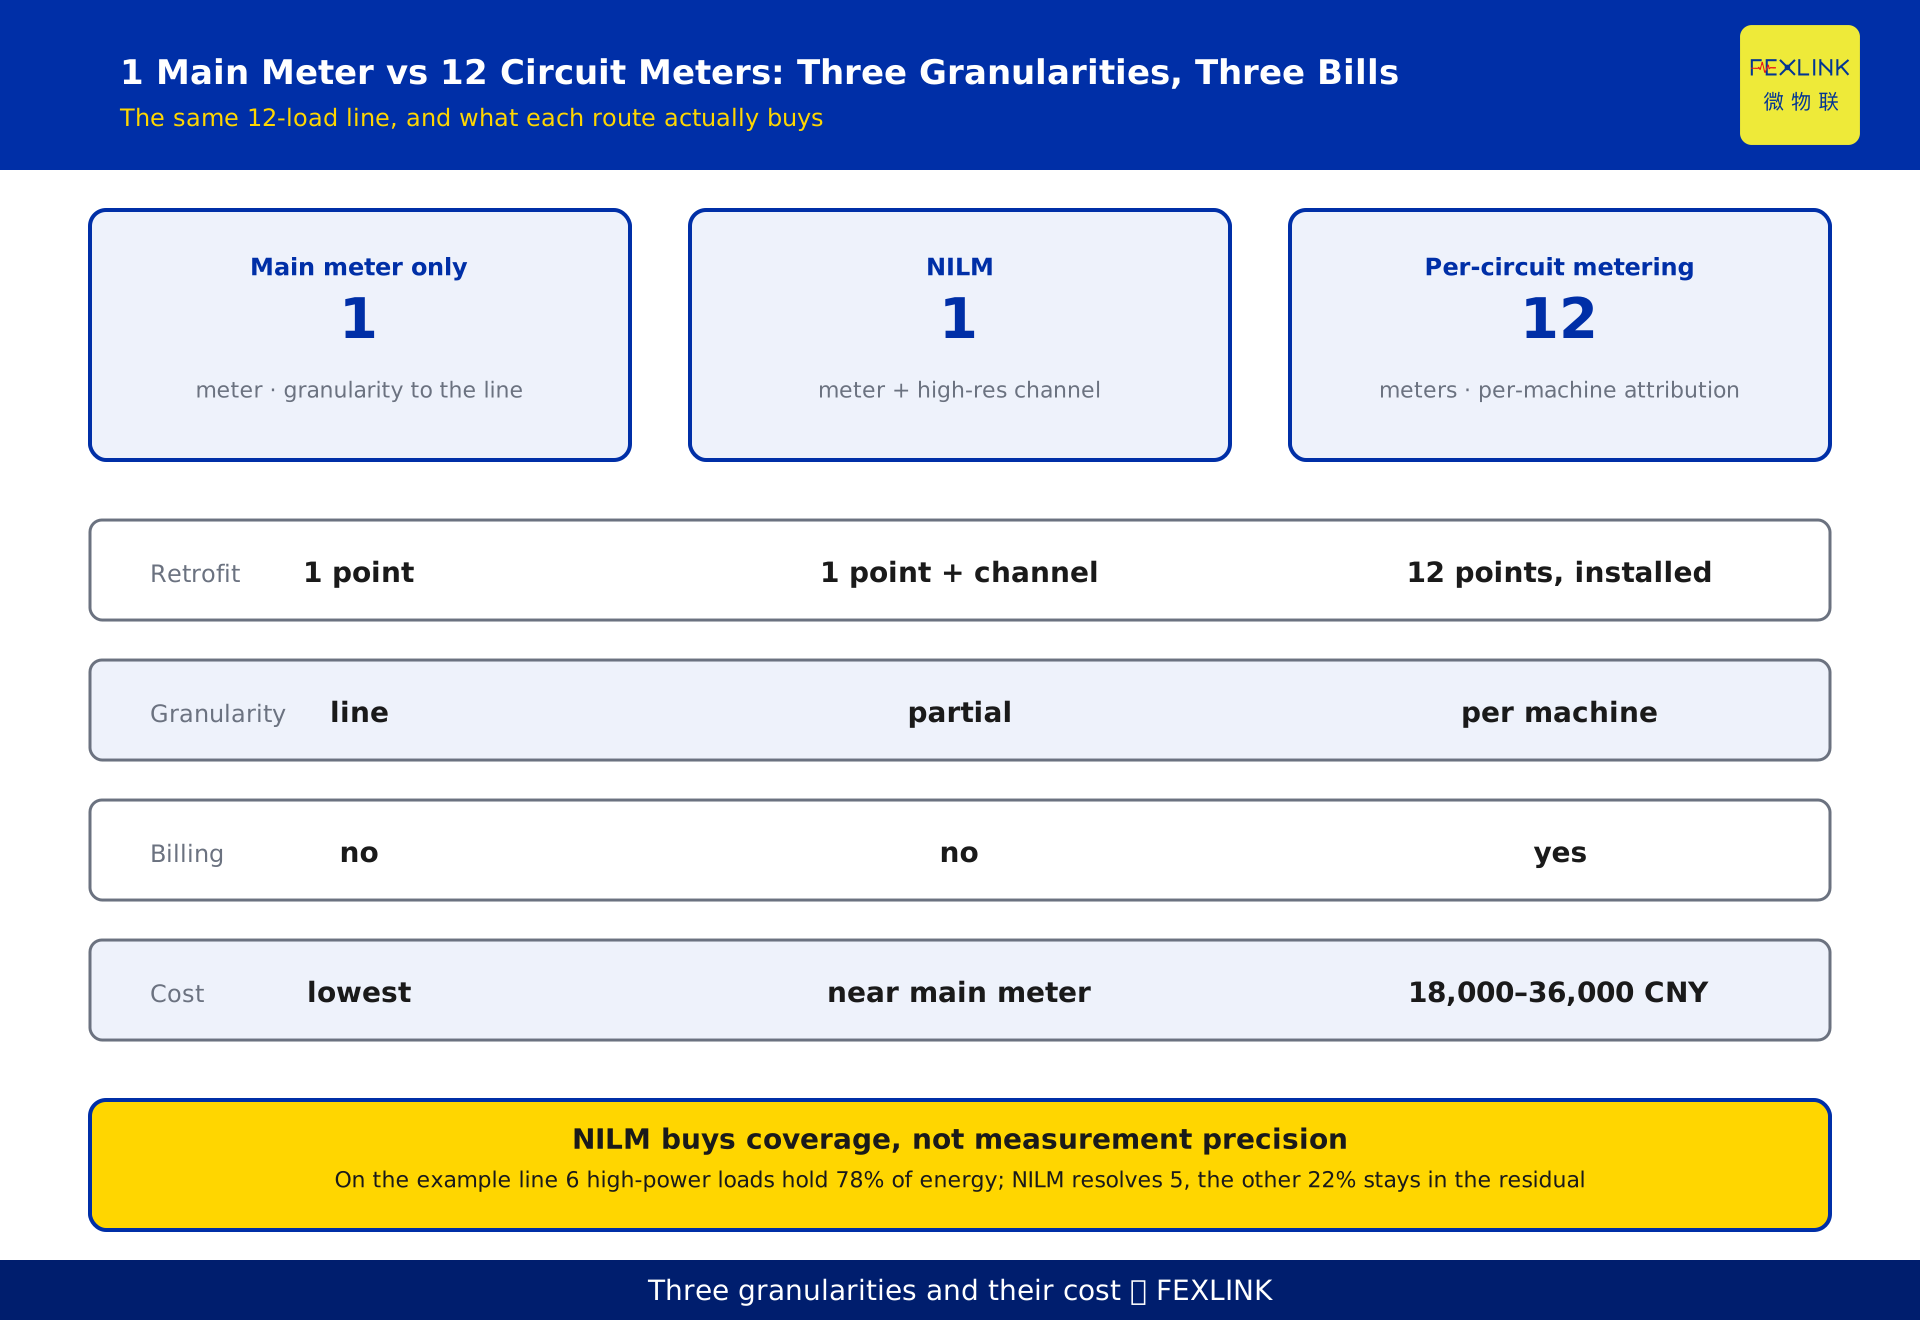
Main meter only. One point, lowest cost, granularity to the line or workshop. You know what the line consumed; not which machine consumed it.
NILM. Still sampling at the main meter. The meter count does not change; the increment is the sampling channel, the algorithm and commissioning. Granularity is partial: large, distinctive loads separate out, the rest stay in the residual.
Per-circuit metering. One meter per machine or circuit. Finest granularity, every kilowatt-hour attributed, usable for assessment and allocation. The price is a multiple of meters and installation points, plus cabinet space and a shutdown window.
The difference is not accuracy but what you buy. The main meter buys a total, per-circuit metering buys attribution, NILM buys coverage — device-level visibility near main-meter cost, but conditional and incomplete.
On cost: circuit meters are priced per point (meter plus installation, an illustrative 1,500–3,000 CNY per point, subject to quotation), so 12 machines land at 18,000–36,000 CNY. NILM adds no meters; the spend sits in the sampling channel and the algorithm service.
5. Accuracy is not a specification, it is a set of site conditions
Quoted accuracy usually comes from a laboratory dataset; whether it reproduces depends on five site conditions.
Sampling and time sync. Minute-level data supports steady-state decomposition only and misses events on machines that switch often; transients and harmonics need sub-second sampling. Drifting time stamps break the alignment.
Circuit topology. How many machines hang off the meter, whether bypasses or cross-cabinet feeds exist, decides whether a separated component can be attached to a named machine. With unclear topology the result cannot be labelled.
Fingerprint library coverage. A new site has no labelled data; the first weeks are clustering results needing human confirmation and naming. For equipment outside the library, resolution drops noticeably.
Load separability. Step size, coincident switching, continuous modulation — decided by the process, not the algorithm.
Distortion and phase balance. Heavy harmonics or marked phase imbalance contaminate the features. Metering suffers too, but NILM separates a mixture and is more sensitive.
So ask not "what is your accuracy" but "on this line, out of these machines, how many resolve reliably, how much energy do they represent, and what order of error should I expect". The first returns marketing; the second, something verifiable.
6. Position the output as a candidate, not a measurement
NILM output suits three uses: an entry point for energy diagnostics (which machine still draws power outside production hours), a lead for fault investigation (a changed signature may mean falling efficiency), and a draft load profile (hours, switching, standby time).
It does not suit three others: billing, assessment and allocation, and externally disclosed energy data. All three require every number to trace to a verified meter; NILM gives probabilistic attribution. Writing that boundary into policy matters more than an accuracy figure in a contract.
7. A constructed example: how to test one line
The figures below are constructed to explain the method and make no claim about accuracy.
A factory line has 12 loads and one main meter: an air compressor at 75 kW, two pumps at 22 kW each, three fans at 15 kW each, and six small loads of 0.5–3 kW. Annual consumption is about 960,000 kWh, roughly 118 tonnes of coal equivalent at 0.1229 kgce/kWh.
Start with the big end: the six high-power machines hold about 78% of the energy, the other six about 22%. Take the 78% first — even if the rest is lost, there is enough visibility for diagnostics.
Then what resolves: five of the six high-power machines separate reliably (the compressor, both pumps, two fans). The third fan is close in rating to another and often starts with it, so the two merge. Two of the six small loads resolve; the rest sit in the residual.
Then the arithmetic: for diagnostics, NILM delivers five machine curves from one sampling point, covering about seventy percent of the energy. For per-machine assessment you need 12 circuit meters at an illustrative 18,000–36,000 CNY, plus cabinet space and a shutdown window. The routes differ in purpose, not merit.
8. Six checks before you commit
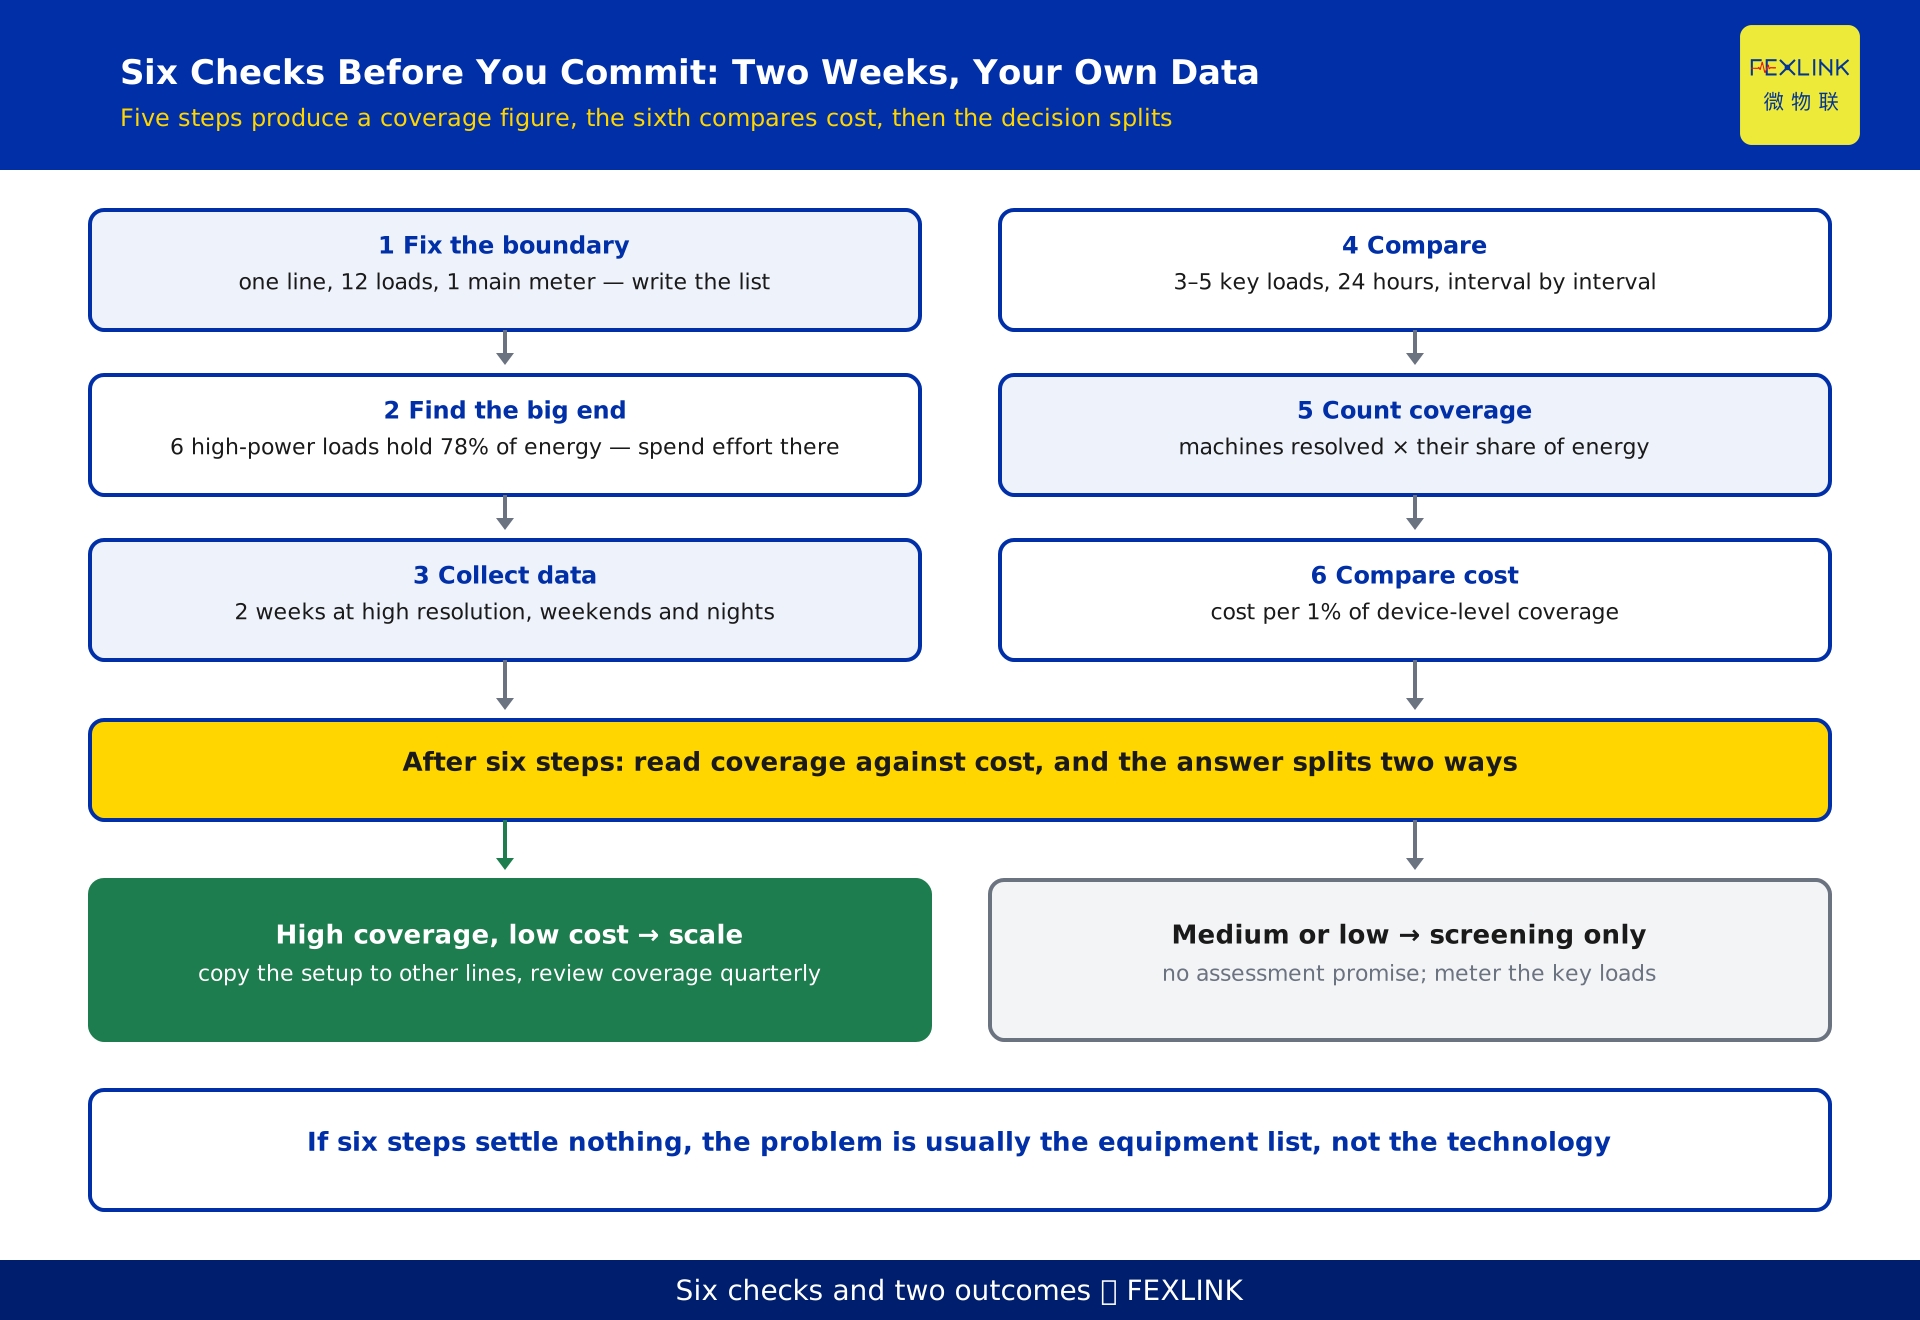
Run six steps on your own data; two weeks gives a preliminary answer.
Fix the boundary. Pick one line and list every load behind the main meter. An incomplete list leaves nothing to compare against.
Find the big end. Estimate each machine's energy share from rating and running hours; find the few carrying seventy percent or more and spend the effort there.
Collect data. Two weeks at high resolution, covering a full production cycle with weekends and night shift. Three days turns an occasional condition into a normal one.
Compare against measurement. Clamp-meter 3–5 key machines, or fit temporary meters for 24 hours, and compare with the NILM output interval by interval. The question is whether switching times and per-run power match, not whether the total does.
Count coverage. Tally how many machines resolve and what share of energy they hold. A good machine count is not good coverage; coverage proves you caught the big end.
Compare cost. Put the NILM quotation beside a circuit-meter quotation for the same scope and compare cost per point of coverage.
The result usually falls one of three ways: high coverage at low cost — scale it; medium coverage — screening tool only; low coverage — meter the circuits.
9. When to choose NILM, when to meter every circuit
Choose NILM when a main meter carries no more than a dozen loads, high-power machines hold seventy percent or more of the energy, most equipment runs in two states, the goal is diagnostics, and a sampling channel can be reused.
Choose per-circuit metering when you need billing, assessment or allocation, machines are small and numerous, inverter-driven modulation dominates, and the cabinet has room and a shutdown window.
Combine them. Meter the main circuits and use NILM for the equipment behind them: meters cover what they can be responsible for, the algorithm fills in visibility, both align on the same list.
The product mapping is direct. Circuit-level metering uses the ESA all-element smart meter (for example ESA-22131-R, 3×400A, 3×220/380V, RS485 Modbus), installed per circuit and read on a fixed time stamp. Decomposition on main-meter data is handled by Tianyan E-01 (NILM non-intrusive load disaggregation), which adds no hardware and identifies equipment from start-up features, steady-state power and harmonics. Above both, the energy diagnostics solution turns results into conclusions, and the digital electrical supervision system returns device-level data to the supervisory view.
Frequently asked questions (FAQ)
Q: Can NILM replace sub-metering for workshop assessment and cost allocation?
No. Both need every number traced to a verified meter; NILM gives probabilistic attribution. It shows which machine behaves abnormally, not who pays.
Q: Most of our equipment is inverter-driven. Does NILM still work?
With lower resolution. An inverter modulates power slowly, so there is no clean event edge; the algorithm leans on steady-state features and harmonic fingerprints, separating the class of load but not reliably the unit. Use NILM for screening and keep metering the key machines.
Q: How much sampling resolution do I need?
Steady-state decomposition works on minute-level data; transients and harmonics need sub-second sampling. Most multifunction meters upload at minute intervals, so a separate channel is required.
Q: A vendor claims over 90% accuracy. Should I believe it?
Ask on what dataset, with what equipment mix, and whether counted by machine or by energy. Ninety percent by machine count may miss the few large loads that matter; by energy it relates to diagnostic value. Ask for per-machine comparison on your own data.
Q: How long does a line-level trial take?
About two weeks: one week of collection, one of comparison, given a complete equipment list and a high-resolution channel.
Q: Once NILM is in, do we still need meters?
Yes. They divide work: meters cover circuits that must be measured and billed, NILM covers equipment with no meter that still needs to be seen. Revisit the split when equipment or processes change.
Scope and limitations
- This article treats NILM as a selection decision for device-level energy data, for industrial and campus sites that have or plan main-meter collection and want device-level visibility without large-scale retrofit. Household disaggregation is out of scope.
- The description of recognition capability explains mechanism and boundary only and commits to no product's accuracy. Real performance varies with sampling, topology, equipment type and duty, and must be established on site.
- The line data in section 7 (12 loads, 6 high-power machines, 960,000 kWh, 78%, 5 machines resolved, 118 tonnes of coal equivalent, 18,000–36,000 CNY) is constructed to explain the method, represents no real customer and no inspection result, and its costs are order-of-magnitude illustrations subject to quotation.
- The electricity equivalent of 0.1229 kgce/kWh comes from the conversion basis of GB/T 2589-2020 and serves only to relate electricity to coal equivalent, not to conclude anything about energy or emissions. Metering points used for billing, assessment or disclosure need verified meters under current metrology rules; NILM output does not replace a measuring instrument.
- Product references — the ESA all-element smart meter, Tianyan E-01 (NILM non-intrusive load disaggregation), the energy diagnostics solution and the digital electrical supervision system — are indicative; models, sampling capability and configuration follow the current selection manual. Nothing here is a procurement recommendation.
Frequently Asked Questions
Is Non-Intrusive Load Monitoring Worth It
NILM — non-intrusive load monitoring — means you do not put a sensor on every machine