 FEXLINK Research Institute
The short answer
The plant has stopped and the switch room is still drawing current. The source is not one machine but a handful of circuits that stay live: control and protection supplies, cooling fans and cabinet air conditioners, trace heating, and the transformer's own no-load loss. Each is small; stacked over every night of the year they become a baseline nobody can explain. The method: measure the night baseline, disaggregate it down to equipment, then schedule disconnection by risk tier. This is usually the easiest electricity to recover.
1. Three kinds of "stopped", only one is off
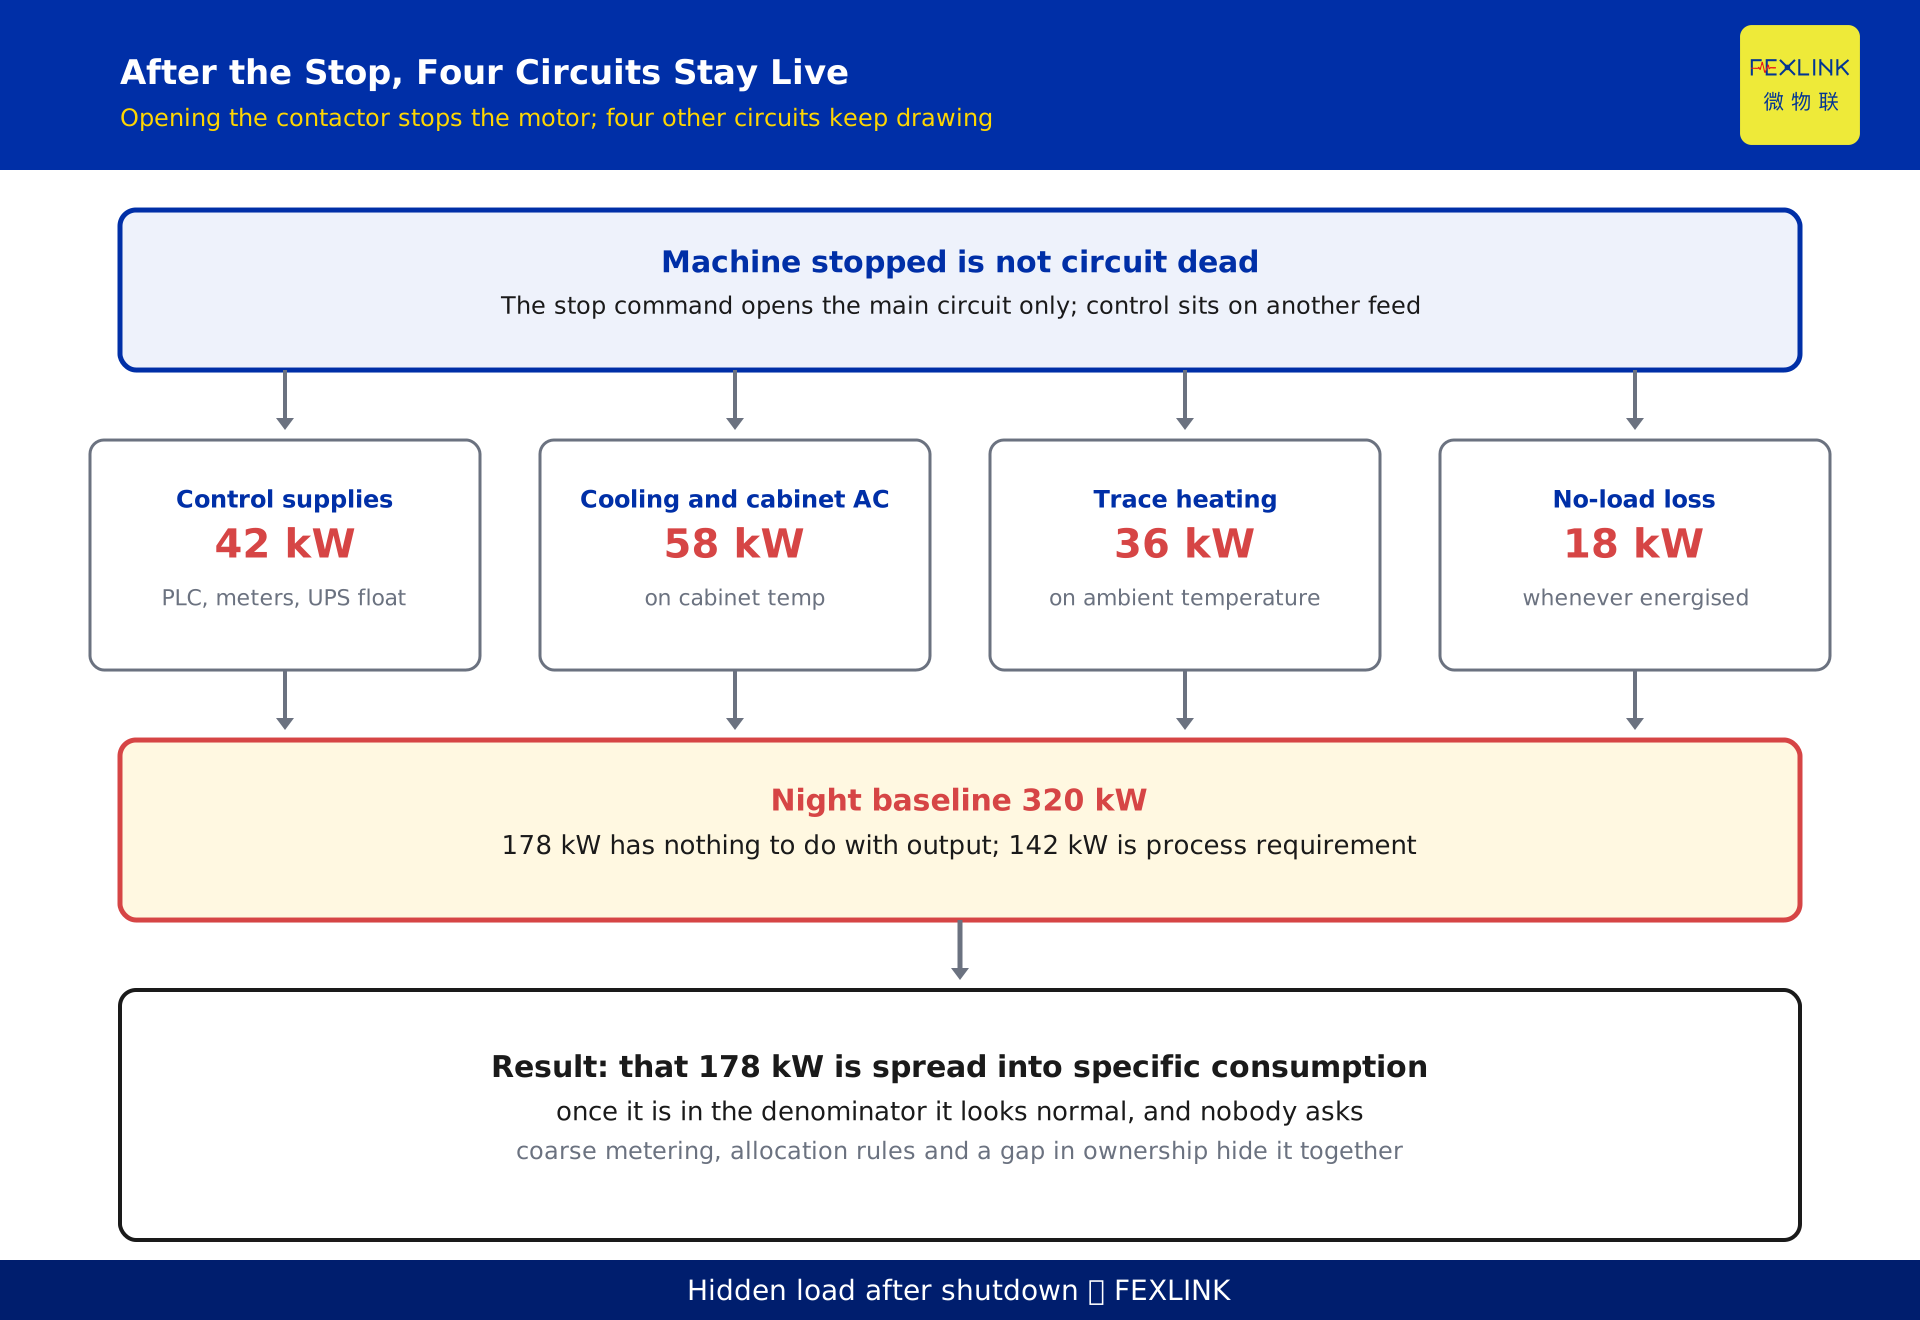
On site, "stopped" usually means the main contactor is open and the line is not producing. But opening the main circuit only stops the motor. The control circuit is often still live: control transformers, 24 V supplies, UPS units and communication modules sit on a separate feed.
So one stop covers three states. Standby: main circuit open, control and sensing circuits live, the machine ready to be woken. No-load: turning or holding pressure without doing work, as with an unloaded compressor or a pump rotating against a closed valve. Disconnected: the isolator is open and there is a visible break.
The three draw very different amounts: standby a few watts to tens of watts, no-load a few tens of percent of rated power, disconnected nothing. The shift log records "stopped", the states collapse into one word, and the electricity with them.
2. What makes up the 320 kW
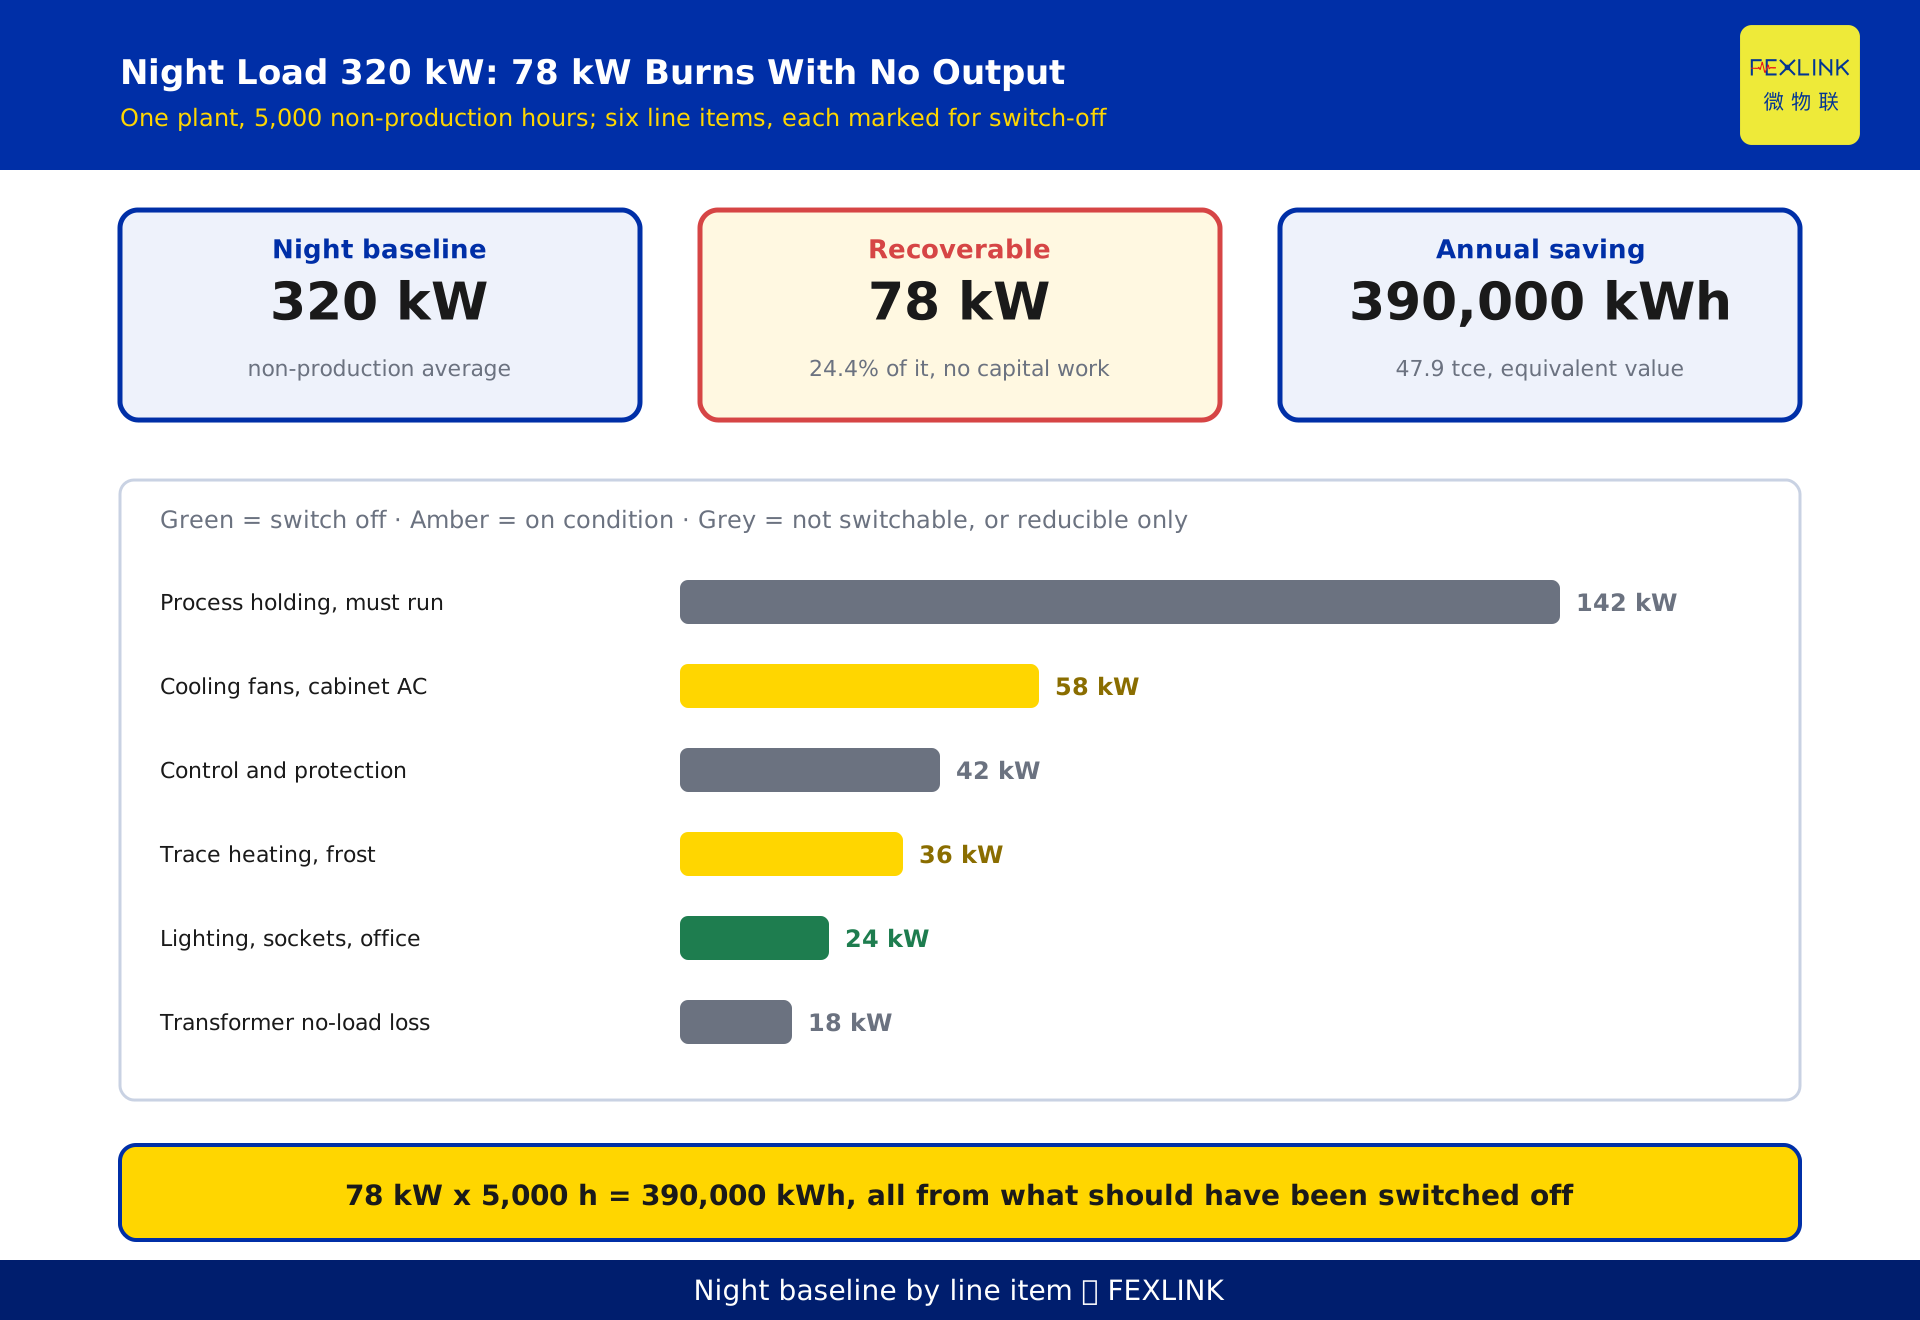
A two-shift plant runs 8,760 hours a year, about 5,000 of them non-production. Over those hours the main meter averages 320 kW.
The following is an illustrative scenario, constructed to show the method; it does not represent any real customer.
| Line item | Night power | Switch off |
|---|---|---|
| Control and protection supplies | 42 kW | No |
| Cooling fans and cabinet air conditioning | 58 kW | Conditionally |
| Trace heating and frost protection | 36 kW | Conditionally |
| Lighting, sockets, office and security | 24 kW | Yes |
| Transformer no-load loss | 18 kW | Reducible |
| Process holding and must-run load | 142 kW | No |
| Total | 320 kW | - |
The first five add up to 178 kW and have nothing to do with that day's output. With zero units produced, the plant still pays for 178 kW every night. The remaining 142 kW is process requirement, outside the scope of the diagnosis.
3. Transformer no-load loss: a term output cannot touch
No-load loss, P0 or iron loss, comes from magnetising the core and from eddy currents. It depends on primary voltage and frequency and barely on secondary load; when voltage departs from rated, P0 varies roughly with the square of voltage. As long as the primary is energised, the loss is there.
Load loss, Pk or copper loss, comes from winding resistance and varies roughly with the square of load current. It follows production: high by day, near zero once the plant stops.
That difference sets the priority: Pk falls on its own, P0 does not. In the example, eight transformers totalling about 12,000 kVA carry roughly 18 kW of no-load loss at night (illustrative; use nameplate and measured data), which over 5,000 hours is 90,000 kWh. Whether it can be cut depends on loading: GB/T 13462, Economic operation of power transformers, sets out how to judge the economic operating band, and running below its lower bound for long periods is uneconomic operation.
4. The scale of standby: a 0.5 W limit and a 50 W reality
Standby power has an established method. IEC 62301, Measurement of standby power, specifies conditions and uncertainty for measurement at low power. EU ecodesign Regulation 1275/2008 sets limits: household and office electronics at or below 0.5 W, information equipment with a display at or below 1 W.
Most industrial equipment falls outside those limits. Contactor coils, drive control boards, servo drives, HMIs, gateways and cabinet fans all draw in standby, from a few watts to several tens of watts (illustrative; measure on site).
A plant counts 1,860 small devices and terminals energised year-round, averaging 3.2 W in standby, 5.95 kW in total. Over 5,000 hours that is 29,760 kWh. One unit is a dozen kWh a year and nobody raises a project for it; multiplied by units and hours it is 30,000 kWh.
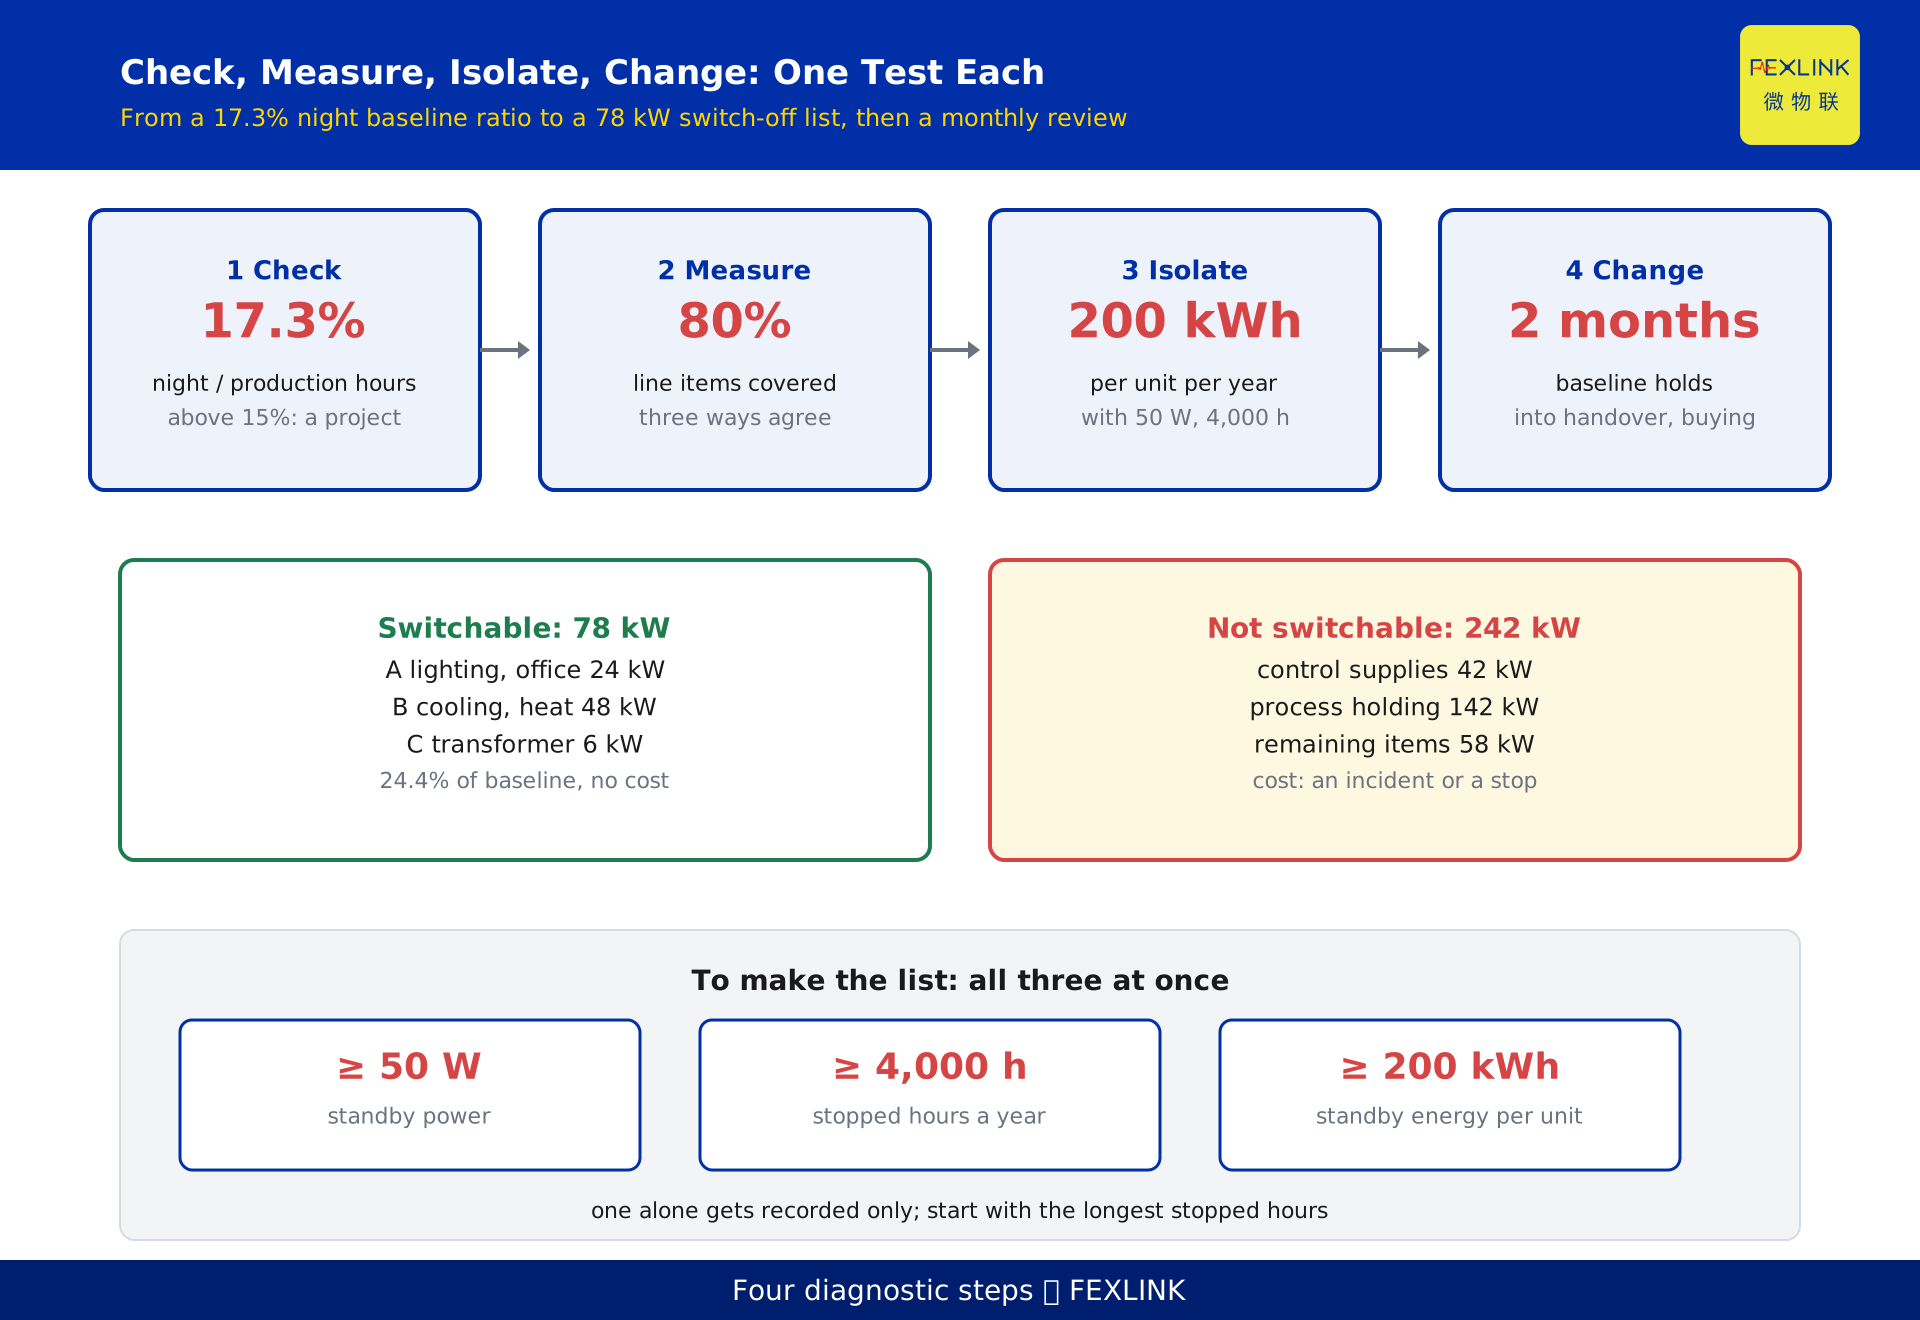
That is the signature of standby loss: too small per unit to manage, too large in total to ignore. The screening threshold is three conditions together: standby at or above 50 W, annual stopped hours at or above 4,000, annual standby energy at or above 200 kWh per unit.
5. Why nobody sees this line
The metering is too coarse. A main meter at 15-minute intervals gives 96 points a day. Night is a flat line, and the flat line hides six line items while the meter reports one total. Without disaggregation there is no object; without an object there is no owner.
The accounting buries it. Energy is allocated to product by output, and non-production hours become a fixed base spread across units. Specific consumption therefore "looks normal", and once the base is in the denominator nobody asks where it came from.
The responsibility has a gap. Production issues the stop, electrical executes the disconnection, and nobody writes down which circuits, when, and who confirms. The handover log says "stopped", not "isolated".
6. How NILM separates "stopped" from "standby"
Non-intrusive load monitoring infers individual switching from the high-resolution power series at the main meter, without opening equipment or adding sensors.
First, event detection: find steps in the power series. A machine starting leaves an upward step, stopping leaves a downward step, and the height of the step is its power. Second, state identification: steady-state power, power factor and harmonic signature are matched against known equipment to decide whose step it is.
Whether a step is visible depends on sampling. At 15-minute intervals, 96 points a day, steps of a few hundred watts are averaged away; at one-second intervals, 86,400 points a day, they appear. Resolving standby steps below a few hundred watts needs sub-second sampling, a constraint of the method rather than a specification of any one device.
NILM has boundaries: simultaneous switching, equipment of similar power and continuously modulated loads blend together. It does not replace measurement; the decomposition proposes, a meter confirms.
7. Worked example: 78 kW of the 320 kW
Back to the example. Grade the 178 kW by risk:
- Class A, off directly: lighting, sockets, office and non-essential security, 24 kW.
- Class B, on condition: 30 kW of cooling and cabinet air conditioning plus 18 kW of trace heating, 48 kW. Conditions must be written down, for example fans above 35 C cabinet temperature, trace heating below 5 C ambient.
- Class C, by economic operation: two transformers out at night, 18 kW down to 12 kW, minus 6 kW.
- Class D, not switchable: 42 kW control and protection, 28 kW remaining cooling, 18 kW remaining trace heating, 12 kW remaining transformer loss, 142 kW process holding, 242 kW.
A, B and C come to 78 kW, 24.4% of the night baseline, with no capital work.
Annual saving: 78 kW times 5,000 hours is 390,000 kWh. At the electricity equivalent value of 0.1229 kgce/kWh that is 47.9 tonnes of coal equivalent; at the equivalent value, using last year's national supply coal rate for thermal power of 0.302 kgce/kWh (illustrative; official values recently about 0.302 to 0.306), it is 117.8 tonnes. The same kilowatt-hours differ by about 2.5 times, so a report must state the convention. At 0.62 per kWh (illustrative tariff) the bill saving is about 242,000, the part available from management change rather than equipment.
8. Four diagnostic steps: check, measure, isolate, change
Check. Compute the night baseline ratio: average active power in non-production hours divided by the same in production hours. Here, 320 divided by 1,850 is 17.3%. Above 15% is worth a project; below 10%, put attention back on production hours. The data is the main meter's history; no new hardware.
Measure. Break the night baseline into line items, covering at least 80%. Three methods: a clamp meter logging 24 hours on representative circuits, circuit meters on the main feeders, and NILM on the main meter data. The three should reconcile, and whatever does not is the next thing to investigate.
Isolate. Produce a three-class list. Class A is executed and written into the shutdown procedure; Class B states the switching condition and who executes it; Class C goes to the electrical engineer. The list carries circuit numbers and switch positions: "open panel 3 circuit 2" and "stop the compressor" are different instructions.
Change. Embed the action: into the handover log, the shutdown checklist and the standby requirement for new purchases, then review the night baseline monthly; it counts as embedded only after two months without a rebound.
9. The tests: what may be switched off, what may not
Safety first, restart second. Four lines are untouchable: fire and security, process holding and frost protection, control and communication, and UPS and battery charging. Switching those off costs incidents or production, not electricity.
For any machine, ask three questions. Is there a safety risk after disconnection? How long is the restart, and does it need re-commissioning? Does it affect work in progress or quality? One "yes" puts it in the not-switchable class. Past those gates, the three-part threshold decides; start with the longest stopped hours, where the return is largest and the argument smallest.
10. Where products fit
Circuit-level metering with the ESA all-element smart meter (for example ESA-22131-R, 3x400A, 3x220/380V, RS485 Modbus), installed per circuit and read per shift, answers the first question: which feeder draws at night. It gives the line-item power the night baseline is built from.
For circuits without a meter, Tianyan E-01 (NILM load disaggregation) decomposes the main meter data and separates each machine's switching times and standby duration, so circuits without meters also become diagnosable.
The findings then need to become a project: the energy diagnosis programme fixes the four steps as a process, and the energy performance improvement framework turns the night baseline into a monthly indicator with crew accountability. Without that, the switching actions are quietly reversed within three months.
11. FAQ
Q: The no-load current at night is high. Is the transformer failing?
Not necessarily. An energised transformer always draws magnetising current, a few percent of rated current. A failing one shows loss departing from nameplate, or a change in temperature rise and noise.
Q: We already have circuit meters. Do we still need NILM?
It depends on granularity. Meters at workshop or line level locate the line, not the machine; machine-level meters mean one per machine and the cost climbs. The usual arrangement is two tiers.
Q: Will switching off at night shorten equipment life or complicate restart?
It depends which part. Control supplies and cooling fans stay live so the machine can start at any moment; restart then means warm-up, self-test and communications re-establishment. Do Class A first, Class B on condition, and leave process-related Class C to the electrical engineer.
Q: One machine draws 3 W in standby. Is that worth managing?
Not one, but many. 3 W over 5,000 hours is 15 kWh, a few yuan a year per unit; 1,000 units is 15,000 kWh. So the action is grouping rather than pulling plugs: put standby devices on shared circuits.
Q: How should the saving be calculated so that it holds up?
Compare like with like: baseline is measured average power in the same non-production hours before the change, reporting period is the same hours after, both multiplied by the same duration, with output and seasonality removed. Do not back-calculate from equipment power times stopped hours.
Scope and limitations
- The method applies to industrial and campus users with defined non-production hours. Continuous process plants have no night baseline and need another convention, such as the lowest-load window.
- The figures 320 kW, 178 kW, 78 kW, 390,000 kWh, 47.9 and 117.8 tonnes of coal equivalent and 242,000 are constructed to illustrate the method and represent no real customer or project.
- Conversion factors: 0.1229 kgce/kWh comes from GB/T 2589-2020; the equivalent value uses last year's national supply coal rate for thermal power, recently about 0.302 to 0.306 kgce/kWh, and the 0.302 used here is illustrative.
- Taking transformers out of service must satisfy N-1, fire and security load requirements, and local utility and design codes. "Two transformers out, 6 kW less" is an example, not an instruction.
- NILM performance depends on sampling rate, load signature and site interference; no accuracy claim is made here.
- Model numbers and specifications for the ESA all-element smart meter and Tianyan E-01 are subject to the current selection manual.
Frequently Asked Questions
Your Plant Is Drawing Power at Night
The plant has stopped and the switch room is still drawing current