 FEXLINK Research Institute
Direct Answer
How much CO₂ does one kWh actually emit? The carbon emission of the purchased electricity = the electricity consumption × the grid emission factor — the recent published national average grid emission factor is at the level of about 0.55-0.6 kg CO₂ per kWh (subject to the latest announcement of the authority), and it updates with the regional grids and the years — the energy managers must understand this factor, because "electricity → carbon" is only a factor away — the energy data is the starting point of the carbon accounting — a wrong factor means a wrong carbon result.
A scenario: A company performs the carbon inventory, and what factor should be taken for the electricity — the finance uses A, the consultant uses B and the Internet shows C — the three differ by 20% — and finally no one accepts the result. The logic is that the first step of the carbon accounting is to fix the factor — the factor changes with the regional grid and the year, it is not a constant decided on a whim — understanding the factor turns the electricity consumption correctly into the carbon emission.
1. Why Electricity and Carbon Are Only a Factor Away
The calculation of the carbon emission — the carbon of the purchased electricity = the consumption × the grid emission factor: one multiplication turns the electricity into the carbon; The meaning of the factor — the average CO₂ emitted on the grid side per kWh used: the "carbon content of the electricity"; The role of the energy data — the consumption is the starting point of the carbon accounting: with the accurate consumption, there is the accurate carbon; The status of the factor — the consumption × the factor: the quality of the consumption data decides the quality of the carbon data — only a factor apart.
In one sentence: the carbon = the consumption × the factor — the energy data is the numerator and the factor is the conversion — the energy managers naturally stand at the starting point of the carbon accounting.
The comparison table of the chain from electricity to carbon:
| Step | Content | Data source |
|---|---|---|
| Consumption | Actual electricity inside the boundary (kWh) | Meter metering |
| Emission factor | Grid average emission (kg CO₂/kWh) | Authority announcement |
| Carbon emission | Consumption × emission factor | Calculated |
| Report | Result and factor source | Carbon inventory report |
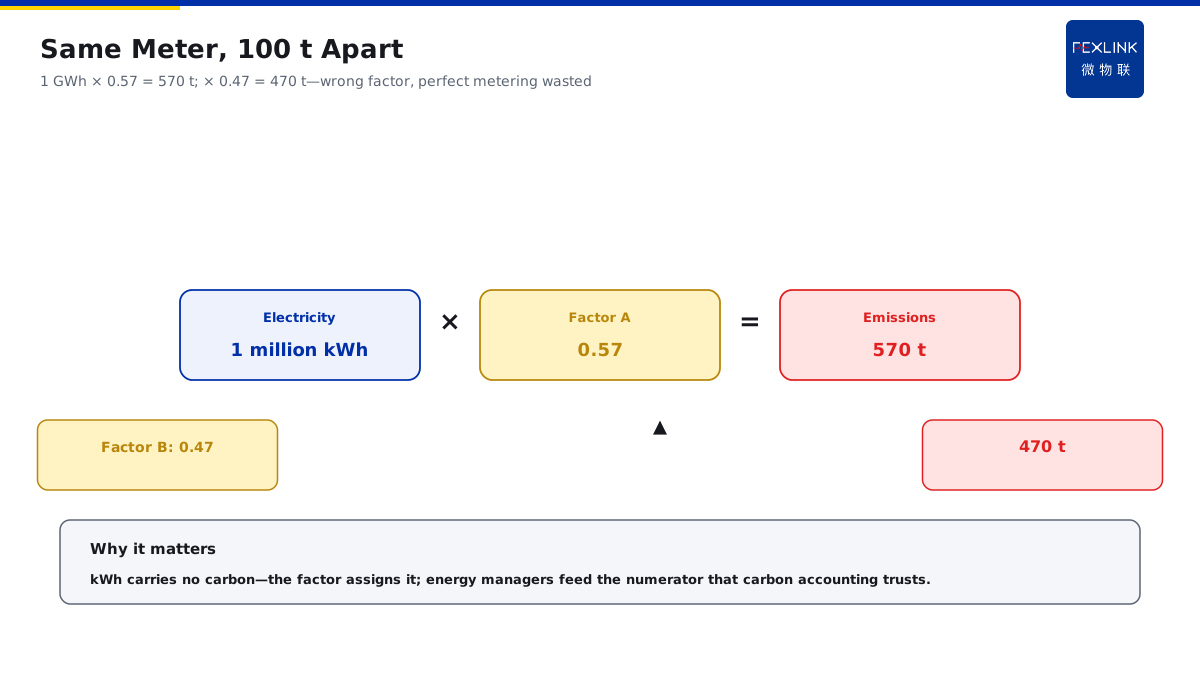
The relationship between the energy and the carbon management — the same consumption data: the energy management asks "how much is used" and the carbon management asks "how much is emitted" — the same source and the factor is the key difference — managing the energy data well means the carbon accounting is half done. An example: A company uses 1,000,000 kWh in a month and the factor is 0.57 kg/kWh — the carbon = 1,000,000 × 0.57 = 570 tonnes — with 0.47 the carbon becomes 470 tonnes — the same consumption differs by 100 tonnes. The logic is that the electricity itself contains no carbon, it is the factor that "grants" it the emission — a wrong factor wastes an accurate consumption — the energy managers must understand the factor, because the consumption is the input of the carbon accounting.
2. The Concept and Update of the Grid Average Emission Factor
The definition of the factor — the average CO₂ emission of the national (or regional) grid per kWh: the emission intensity of the whole grid; The update of the factor — updates every year with the power structure: the higher the share of the wind and solar, the lower the factor; The publication of the factor — announced regularly by the authority: use the latest value, not the outdated one; The level of the factor — the recent national average is about 0.55-0.6 kg CO₂ per kWh: the exact value is subject to the latest announcement.
In one sentence: the factor is not a constant but a variable updating every year — when the power structure changes, the factor changes — the carbon inventory must use the latest published value.
The timeline of the publication and update — the authority announces the national/regional factors regularly: the enterprise uses the latest value; in a cross-year inventory: take the factor of the reporting period; when a new version is published: the old is void and the new is used immediately — a clear timeline, no confusion.
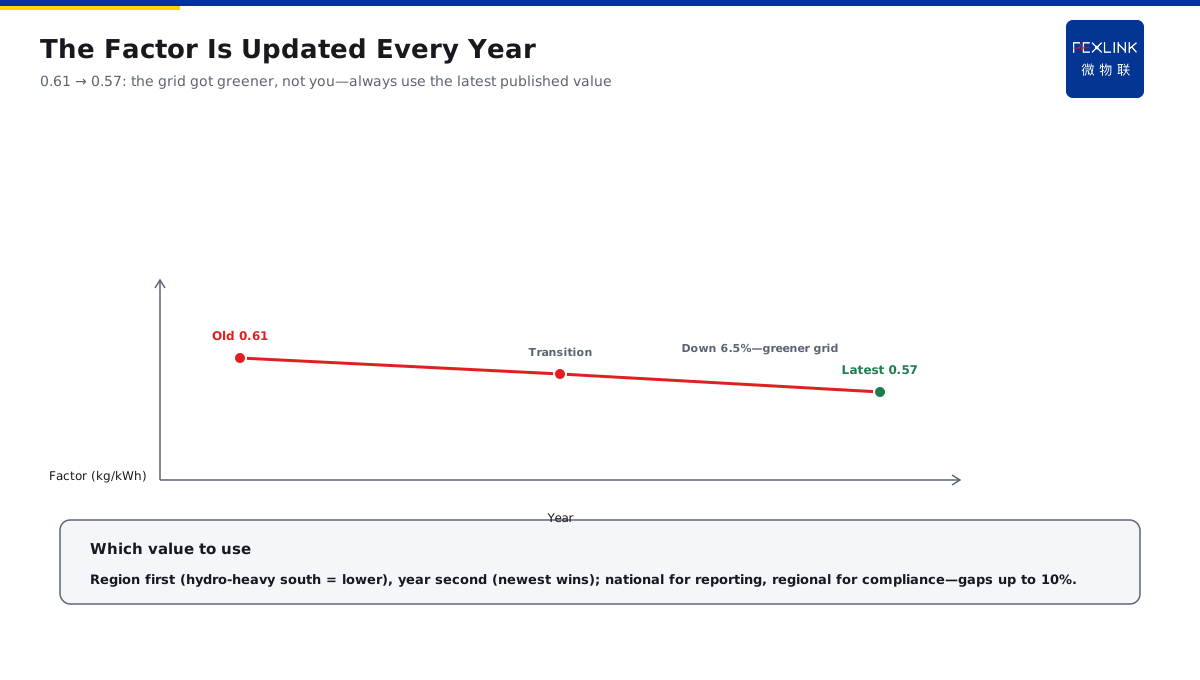
The channels of obtaining the factor — the official publication of the authority: the first-hand source; the value quoted by the standards/guides: check the version and the year; the third-party reprint: verify back to the official website — a reliable source, a credible value. An example: A company used the old factor 0.61 two years ago and the new 0.57 this year — the same consumption now shows 6.5% less carbon — not that the company became green, but the grid became greener. The logic is that the falling factor is "the credit of the grid", not "the credit of the enterprise" — with the new factor the carbon reflects the status — updating the factor every year is the compliance of the carbon inventory.
3. The Difference Between the Regional and the National Factors
The national average factor — the average of the whole national grid: for the accounting of the national unified basis; The regional grid factor — the average of the regional grids (North China/East China/Central China/South China, etc.): reflects the regional power structure; The reason for the regional difference — a region rich in hydro has a lower factor and a region dominated by thermal has a higher one: the structures differ; The principle of choosing — the factor of the region where the enterprise sits comes first: the regional factor is closer to the reality.
In one sentence: the national factor is the "overall average" and the regional one is "by area" — a hydro-rich province has a low factor and a thermal-rich one a high factor — choose the factor by the region first.
The comparison table of the national and regional factors:
| Scenario | Factor | Note |
|---|---|---|
| National unified reporting | National average | Consistent and comparable |
| Regional inventory/compliance | Regional grid | Closer to the actual carbon |
| Multi-region group comparison | Each region's factor | Reflects the regional difference |
| Green power/certificate | Zero-carbon factor | By the certificate |
A quantitative sense of the regional difference — a hydro-rich region has a lower factor than the national and a thermal-dominated one a higher factor — the difference between the regional and the national can reach the level of 10% — a wrong basis means a deviation of that level. An example: A company in the China Southern Power Grid area: the regional factor is lower than the national (a high hydro share) — with the national factor the carbon is overestimated — with the regional one it is closer to the reality. The logic is that choosing the national or the regional directly changes the result — the regional factor is closer to the actual carbon content of the electricity — stating the basis of the choice makes the review accept it.
4. How Green Power and Green Certificates Change the Factor
The meaning of the green power — the electricity from the renewables (wind, solar and hydro): almost zero emission in the generation; The accounting of the green power — the purchased green power is calculated by the green factor (near zero): the carbon drops significantly; The accounting of the certificates — the electricity corresponding to the certificates is treated as zero-carbon: the certificate is the "carbon attribute voucher" of the green power; The basis of the accounting — follows the official green power/certificate rules: no free offset.
In one sentence: the green power "greens" the factor — the purchased green power is calculated as zero-carbon and the certificated electricity as zero-carbon — but the offset follows the rules, not at will.
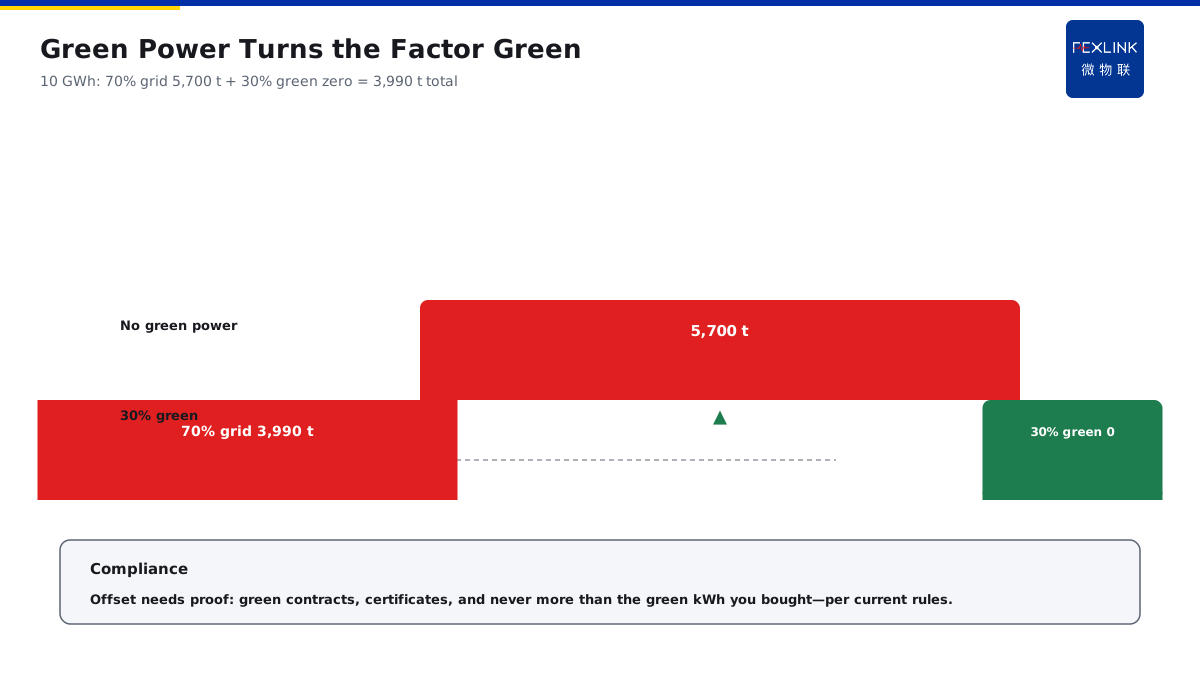
The check list of the green power/certificate accounting — the green power contract and the settlement: proving the real purchase; the certificate holding records: proving the corresponding electricity; the correspondence between the green power and the total consumption: the offset does not exceed the actual green power; the version of the rules: the latest rules — the four checks make the offset compliant. An example: A company consumes 10,000,000 kWh a year and 30% is green — the normal factor gives 5,700 tonnes and the green part is zero-carbon — the total = 70% × 5,700 = 3,990 tonnes — down 30%. The logic is that the green power is a legal "carbon reduction tool" — buying the green power and holding the certificates treat the factor as zero-carbon — but the offset needs the vouchers and follows the rules, not just a name without the electricity.
5. How the Factor Choice Affects the Carbon Inventory
The extent of the impact — a 10% difference in the factor means a 10% difference in the result: the factor is one of the biggest variables of the carbon result; The affected step — the scope-2 accounting (the purchased electricity): the factor directly decides the scope-2 carbon; The basis of the value — the latest published value + the region + the green power: the three bases fix the factor; The traceability of the value — the factor source is written into the inventory report: which year and which region, stated clearly.
In one sentence: a 10% difference in the factor means a 10% difference in the result — the three bases (latest/regional/green power) are written clearly — a traceable factor source makes the inventory reviewable.
An example: A company's inventory report states "the national average factor published in 2022, adjusted by the regional grid and the green part as zero-carbon" — the review rechecks: sufficient basis and correct calculation — the report passes. The logic is that the factor is not "taking a number" but "stating the basis" — which factor and why, written clearly — half of the credibility of the carbon inventory lies in the transparency of the factor value.
Back to the smart energy-carbon IoT platform — the digital management of the carbon factors: the platform embeds the national/regional factor library and updates automatically with the announcements, the consumption is carried over monthly, the green power and the certificates are marked separately, and the carbon is calculated automatically with the traceable factor source — the electricity → the factor → the carbon, one chain done automatically — the inventory changes from "looking up the factor in a table" to "calculated by the platform".**
Scope and Limitations
- The conclusions in this article are intended for LV distribution and electrical-safety sites. Standard numbers (GB/T 32150) refer to their currently effective editions, and product parameters follow the latest FEXLINK selection handbook and product knowledge base.
- Quantitative criteria (protection zone, discharge and residual voltage, earth resistance, thresholds and grading) hold under the preconditions stated in this article. Where the site voltage level, earthing arrangement, environmental category or load profile differs, the figures must be recalculated. Specific configurations involving Tianyan engine E-09 (carbon accounting) should be verified against actual circuit parameters.
- Specific product models and parameters are subject to the latest selection handbook and product knowledge base; this article does not constitute selection or procurement advice.
- Standard numbers cited here refer to the currently effective editions; when a standard is revised, the related quantitative conclusions must be re-checked.
- Deployment and implementation for specific projects must be carried out by qualified engineers based on site survey and design drawings.
Frequently Asked Questions
How Much CO₂ Does One kWh Actually Emit
The carbon emission of the purchased electricity = the electricity consumption × the grid emission factor — the recent published national average grid