 FEXLINK Research Institute
Direct Answer
How is the enterprise energy balance calculated? The balance is based on the basic equation "input = effective use + loss", balanced level by level (the equipment, the workshop and the enterprise) — the input energy (the electricity, the fuel and the steam) finally goes to: one part becomes the effective output and one part becomes the loss — a balance deviation above 5% usually means the metering gap or the statistical inconsistency — when the account is balanced and the deviation is controlled, the flow becomes clear and the renovation has the basis.
A scenario: An enterprise does the balance — the input 100, the calculated effective plus loss only 85 — 15 points cannot be matched — the account "cannot be balanced" and the loss head cannot be found. The logic is that the balance is "the energy account" — the income (the input) must equal the expenditure (the effective + the loss) — if not, check the metering and the consistency first — the account balanced, the flow credible.
A balance example — An enterprise: the monthly input 1 million kWh of electricity and 50,000 m³ of gas — converted to the standard coal, the total input about 180 tce — the effective use 130 tce and the loss 50 tce — the deviation 0%, the account balanced.
1. The Basic Equation of the Enterprise Energy Balance
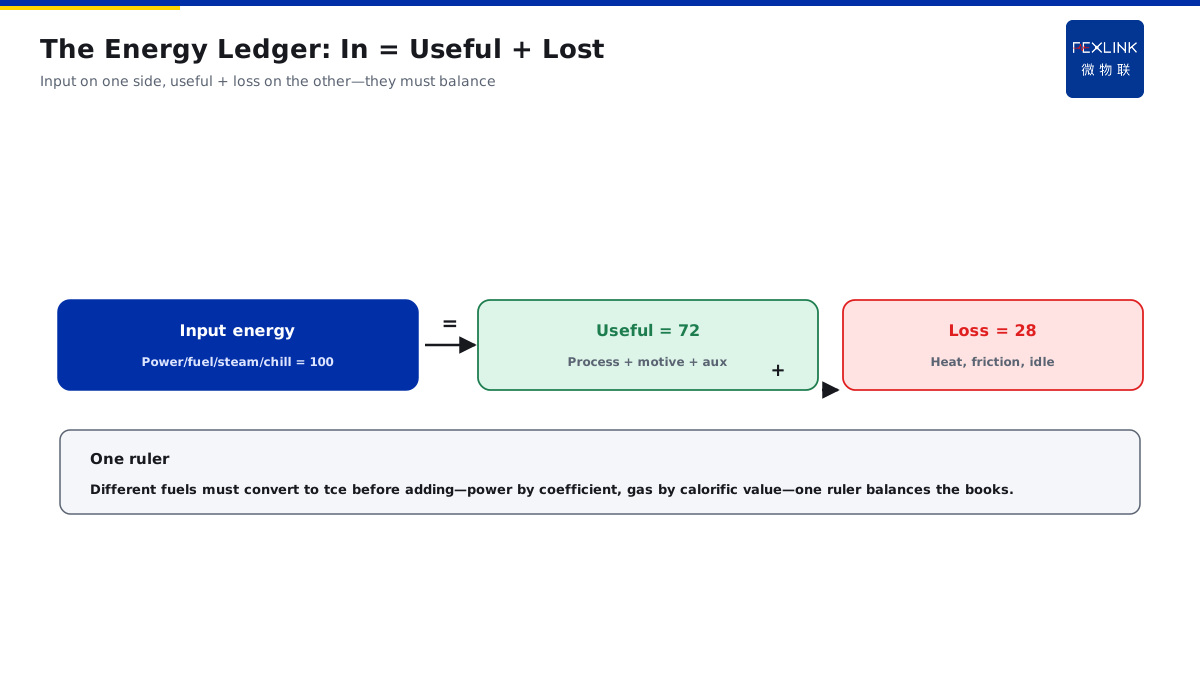
The basic equation — the input energy = the effective use + the loss: the engineering expression of the energy conservation; The input energy — the purchased electricity, the fuel, the steam and the cooling: all the energy entering the enterprise; The effective use — the energy turned into the products and the services: the process and the power; The loss — the exhausted and the dissipated: the exhaust, the heat, the friction and the standby.
In one sentence: the equation is "the energy account" — the input on one side and the effective + the loss on the other — the two must be equal, the account balanced.
The input classification — the electricity, the fuel (coal/gas/oil), the heat (steam/hot water) and the cooling (chilled water) — the four, measured separately; The effective classification — the process, the power, the lighting/air-conditioning and the other — the four, counted one by one. An example: The monthly input 1 million kWh — the effective 720,000 (the process + the power) — the loss 280,000 (the heat + the standby) — 72+28=100, the account balanced. The logic is that the equation is "the skeleton" — the input, the effective and the loss classified — every item has the destination, the account balanced.
The energy conversion — different energies must be converted to the standard coal to add: the electricity by the coefficient and the gas by the heat value — the unified, the account balanced.
2. How to Read the Energy Flow (the Sankey)
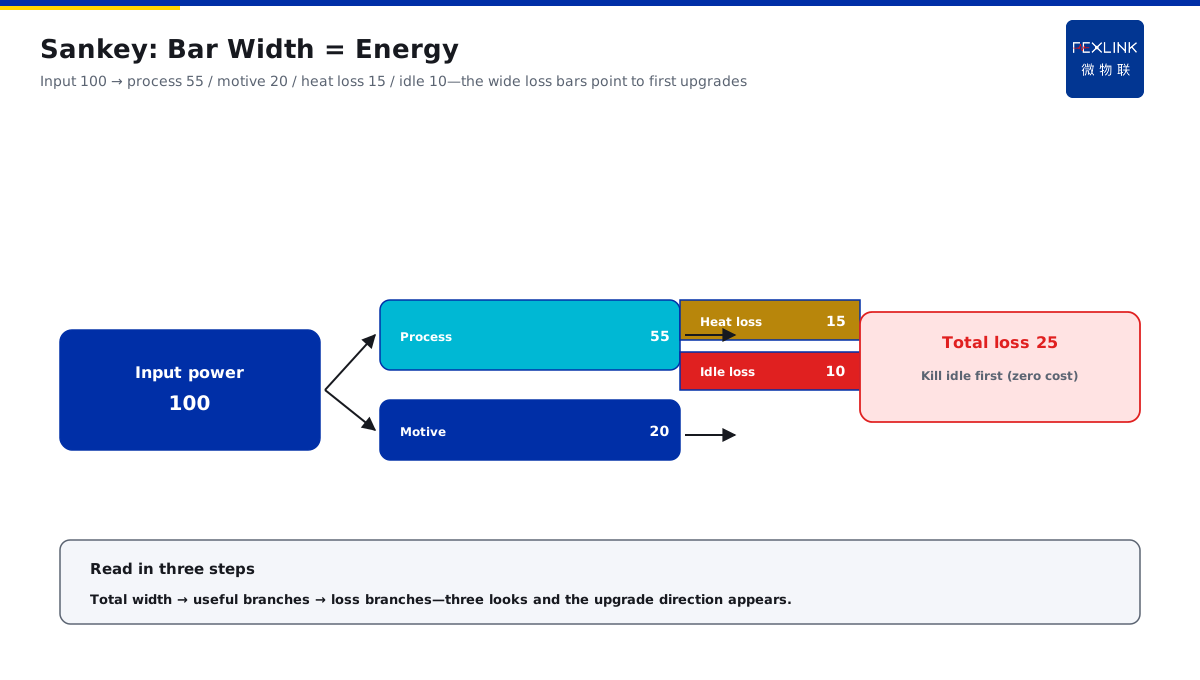
The meaning — the energy flow: the band width represents the energy size, from the input to the destination; How to read — the wide band is the head and the narrow is the tail: one glance at the destination; The focus — the width of the loss branch: the wide loss, the waste head here; The value — turning "the account balanced" into "the understood": the flow intuitive and the problem visible.
In one sentence: the Sankey is "the visualization of the energy account" — the width = the size — the wide loss branch is the priority of the renovation.
The relation — the Sankey is the graphic of the equation: the input total width = the effective total + the loss total — the figure matches the account and the account matches the figure. The reading three steps — first the input total (the total amount); then the effective branch (the output share); finally the loss branch (the waste head) — the three, the direction emerges; The common forms — the single-level (the input direct to the destination) and the multi-level (through the conversion: the electricity→the heat→the process) — by the process complexity. An example — The Sankey: the input 100 — the process 55, the power 20, the heat 15 and the standby 10 — the standby narrow but no output — cut the standby first, saving 10 points. The priority formula — the zero investment (the management) → the low investment (the operation) → the high investment (the equipment) — the three levels, the fastest effect. The logic is that the Sankey "draws out" the balance — the width comparison shows the loss head at a glance — the figure read, the direction clear.
A multi-level example — The electricity input → the transformer (the conversion loss 3%) → the process (65%) + the power (20%) + the heat loss (12%) — the multi-level shows the conversion loss.
3. The Level-by-Level Balance and the Deviation Check
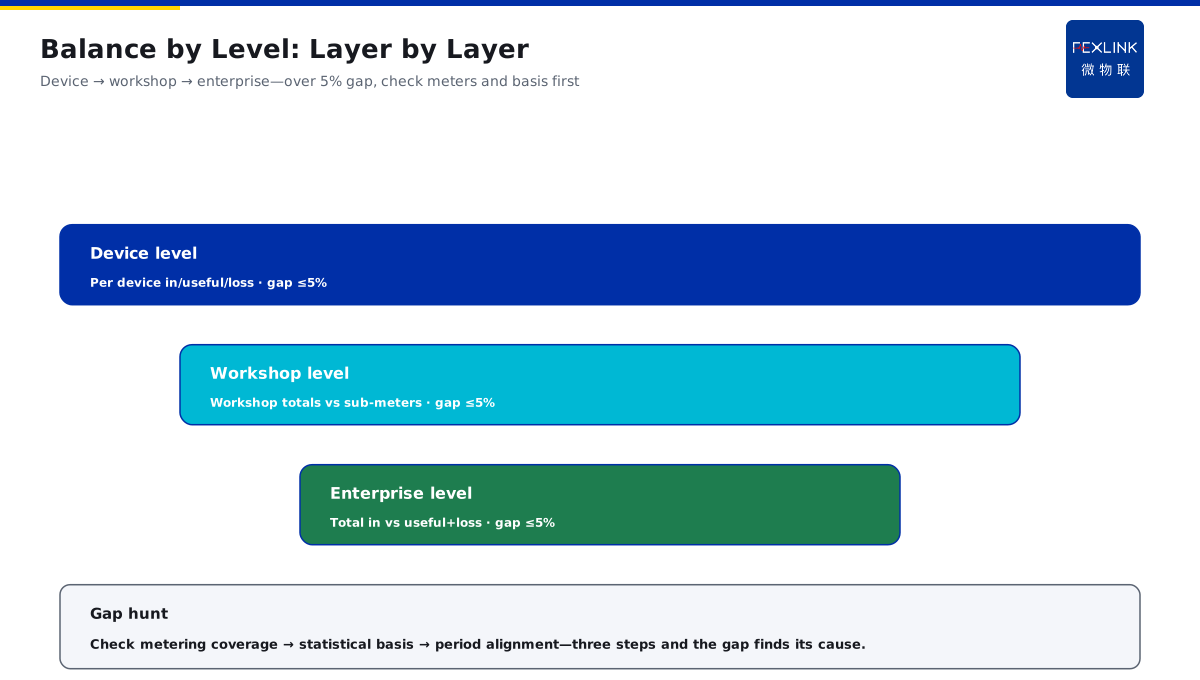
The level-by-level — the equipment first, then the workshop and finally the enterprise: balanced and checked level by level; The deviation — the difference between the input and the effective + the loss: the deviation = (the input - the effective - the loss) / the input; The threshold — above 5%: usually the metering gap or the inconsistency; The handling — check the metering first and then the consistency: if not found, add the measurement.
In one sentence: the level-by-level is "the layered reconciliation" — the equipment, the workshop and the enterprise — above 5%, check the metering and the consistency first.
The check table:
| Level | Balance | Deviation |
|---|---|---|
| Equipment | In/effective/loss | ≤5% |
| Workshop | Summary vs items | ≤5% |
| Enterprise | Input vs sum | ≤5% |
The deviation sources — the metering gap (no meter/inaccurate) and the inconsistency (the classification/the period) — the two, checked separately; The check order — the metering completeness, the consistency and the period alignment — the three steps, the deviation located; The sequence — the key equipment first → the workshop summary → the enterprise — from the bottom, the account more complete. An example — The enterprise deviation 8% — the check finds the air station without the meter — after the meter, 3% — the account balanced. The logic is that the deviation is "the traffic light" — above 5%, the red light, the account has the problem — check and add level by level, the account credible.
4. The Influence of the Incomplete Metering
The performance — some circuits without the meter: the input or the loss only estimated; The influence 1: the input inaccurate — the total does not match the sub-meters: the input higher or lower; The influence 2: the loss omitted — the unmeasured circuits all into "the others": the loss head hidden; The influence 3: the deviation enlarged — the more estimated, the larger: the balance not credible.
In one sentence: the incomplete metering = "the blind zone" — the circuits without the meter can only be estimated — more estimated, the account cannot be balanced.
The loss classification — the exhaust, the heat, the friction, the electrical and the standby — the five, measured by the category to find the head. The metering reference:
| Position | Role | Missing |
|---|---|---|
| The total income | The input base | Inaccurate |
| The sub-circuits | The split | Loss omitted |
| The key equipment | The equipment balance | Deviation enlarged |
| The loss points | The loss quantified | Head hidden |
The three levels — the total, the sub-item and the equipment — the three covered, the balance with the data; The calibration — the regular precision check and the reading consistency — the accurate, the balance accurate; The point selection — by the balance need: the input measured, the sub-items divided and the loss focused — follow the balance, no more and no less. An example — The enterprise without the exhaust temperature — the heat loss all estimated — the deviation 10% — after the exhaust point, 4%. The metering missing example — The chilled water circuit unmeasured — the heat input estimated by the steam — the deviation 8% long — after the chilled water meter, 2%. The logic is that the metering is "the eye" — the invisible only estimated — the point added, the loss visible and the account balanced.
Back to the SFE and the ESA — the data foundation: the ESA measures the total and the sub-items and the SFE supplements the power quality and the loss — the metering complete, the deviation controlled.
5. How the Balance Points to the Renovation
The result = the map — the loss head is the priority: the wide first; The sorting — by the share × the difficulty: the easy first and the large first; The estimation — the reduced loss = the saving: the heat 3 points, the saving 3 points; The verification — the balance again after the renovation: the before-and-after, the effect checkable.
In one sentence: the result points to the renovation — the wide loss is the priority — the balance again after the renovation, the effect verifiable.
The report structure — the input list, the effective list, the loss list, the Sankey, the deviation note and the renovation suggestion — the six parts, complete. The seven opportunities — the waste heat recovery, the insulation, the VFD, the high-efficiency replacement, the process optimization, the energy substitution and the management — the seven, evaluated one by one; The quantification — the two balances before and after: the loss change is the saving — quantified, the input-output clear; The input-output analysis — the saving × the price = the annual saving; the investment ÷ the annual saving = the payback — the two numbers, the basis of the decision; The cycle — the annual enterprise balance, the quarterly key workshop and the before-and-after — the cycle rolling, the account often balanced and the renovation often new. An example — The balance finds the heat 15% the largest — the insulation — after the renovation, 10% — the balance verifies 5 points. The logic is that the balance is "the start" and the re-balance is "the verification" — one round and one renovation, the saving rolling.
Back to the energy supervision center solution — the platform: the collection (the ESA/SFE) → the level-by-level balance (the platform) → the Sankey (the visualization) → the renovation tracking (the solution loop) — the chain complete — the enterprise balance, starting from the account.
Scope and Limitations
- The conclusions in this article are intended for LV distribution and electrical-safety sites. Standard numbers (GB/T 3484) refer to their currently effective editions, and product parameters follow the latest FEXLINK selection handbook and product knowledge base.
- Quantitative criteria (protection zone, discharge and residual voltage, earth resistance, thresholds and grading) hold under the preconditions stated in this article. Where the site voltage level, earthing arrangement, environmental category or load profile differs, the figures must be recalculated. Specific configurations involving SFE power-quality multi-element controller, ESA all-element smart meter should be verified against actual circuit parameters.
- Specific product models and parameters are subject to the latest selection handbook and product knowledge base; this article does not constitute selection or procurement advice.
- Standard numbers cited here refer to the currently effective editions; when a standard is revised, the related quantitative conclusions must be re-checked.
- Deployment and implementation for specific projects must be carried out by qualified engineers based on site survey and design drawings.
Frequently Asked Questions
How an Enterprise Energy Balance Is Built
The balance is based on the basic equation "input = effective use + loss", balanced level by level (the equipment