 FEXLINK Research Institute
The short answer
A platform nobody uses is rarely a software problem. Going live only moves data to a new place; it does not create anyone who owns that data. Three things must land together: a named energy manager, a point list someone actually maintains, and a routine that runs daily and meets monthly. The test is blunt: 90 days after go-live, if the daily report is still exported from several systems and stitched together in Excel, the system has not gone live.
1. Six symptoms you can count
Three or more means the platform is becoming an expensive dashboard.
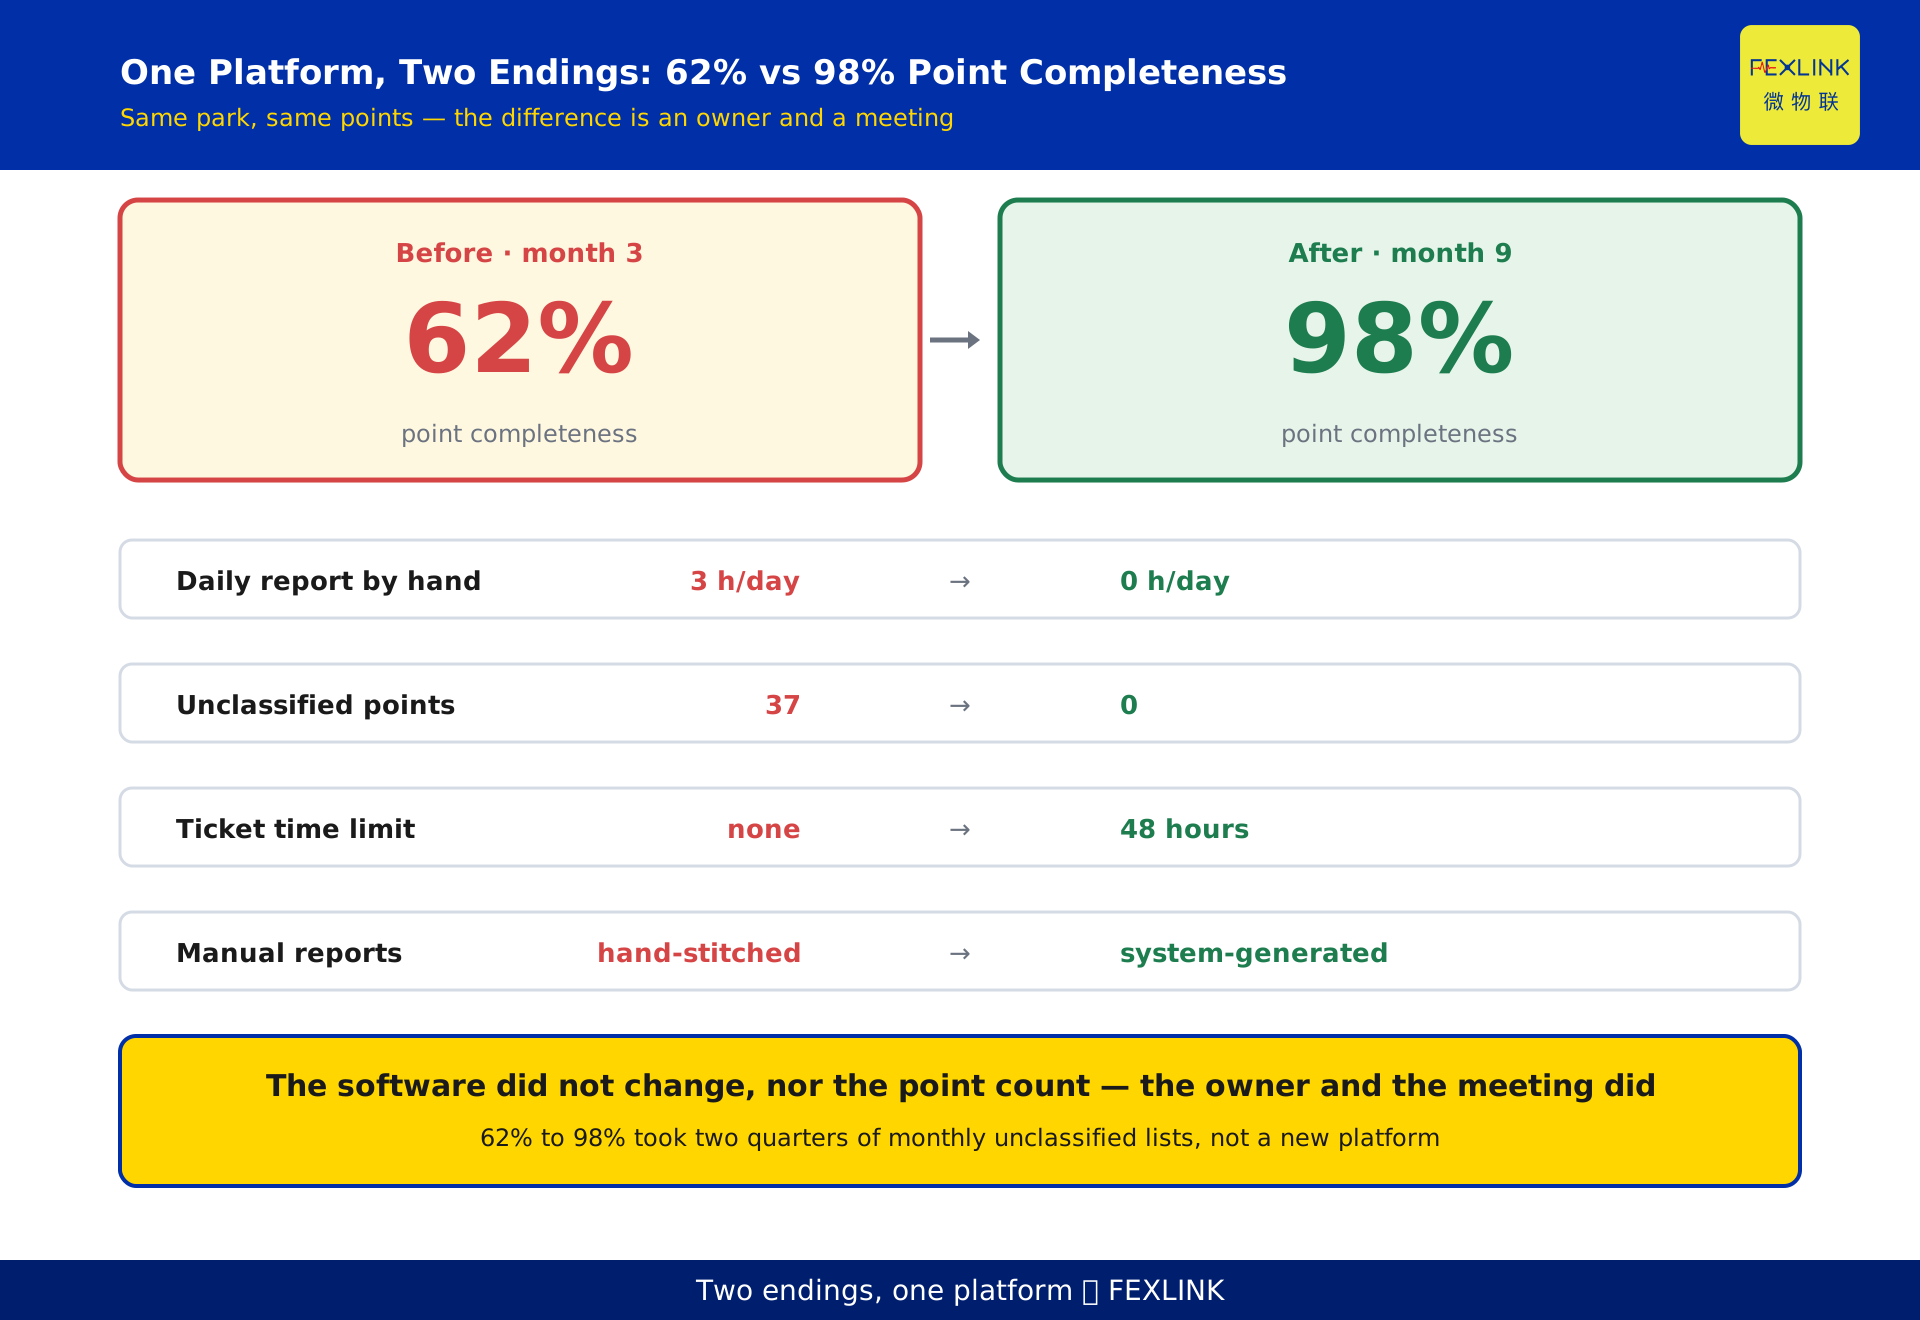
The daily report is still assembled by hand. The energy manager exports from metering, production and finance each morning, aligns them in Excel and posts to a chat group. In one anonymized park at month 3, this took 3 hours a day.
A point reads 0 or a constant for 7 days straight. A circuit that is genuinely running cannot produce an identical daily figure for a week. A flat line usually means collection stopped, or the multiplier was never set.
The report differs from the finance ledger by more than 3%. Platform energy and billed energy do not match, and nobody can explain the gap. That gap is usually a definition problem, not a meter problem.
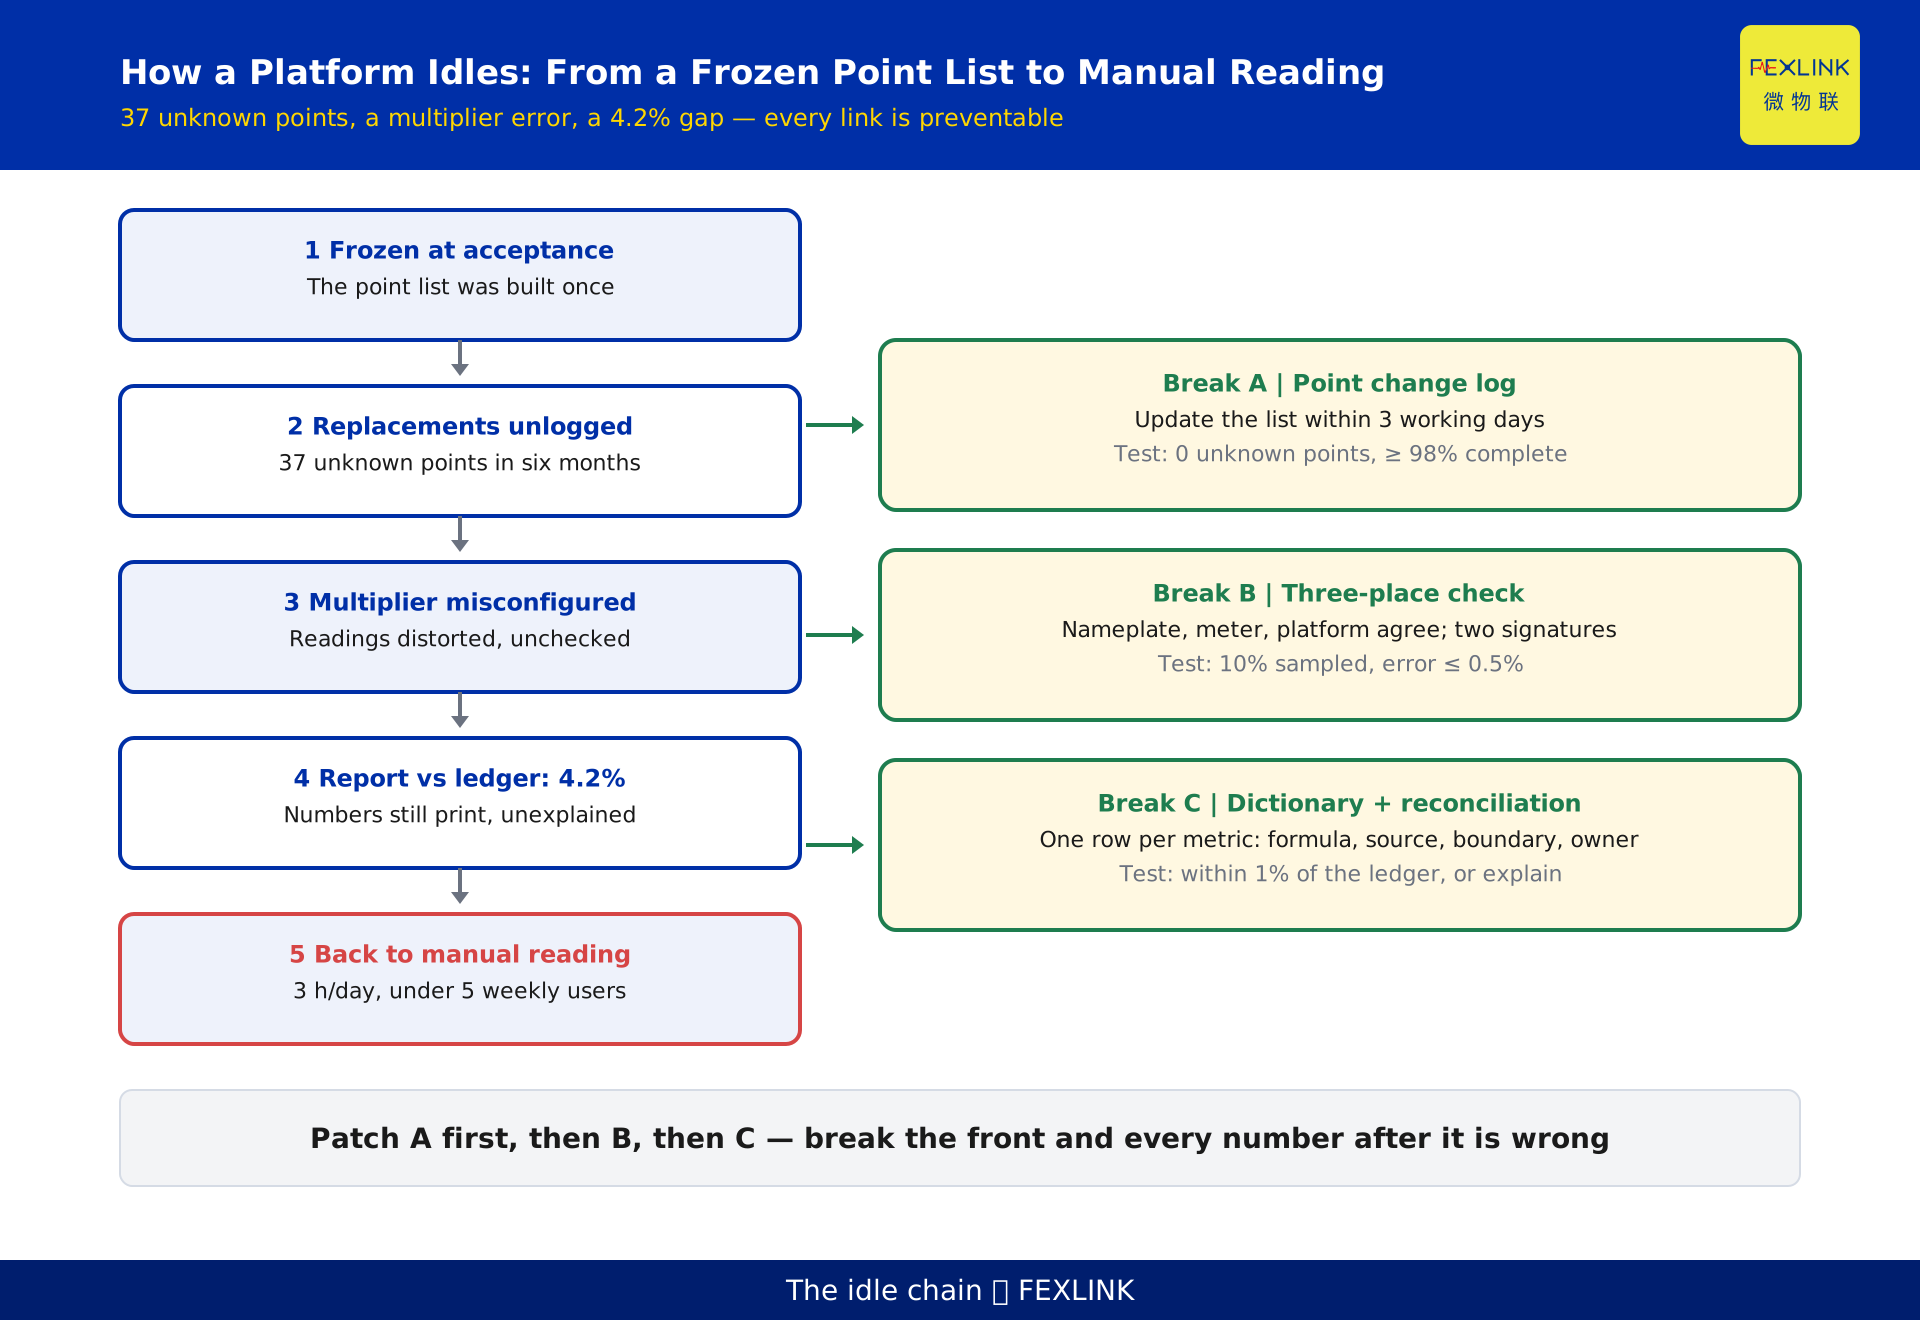
The point count grows but nobody claims the points. Six months in, 37 unknown points have appeared with no area, owner or metering object, yet they keep counting toward the total.
Alarms are acknowledged, never resolved. Clicking "seen" costs nothing, so nothing happens afterwards. Within three months these alarms get muted wholesale.
Fewer than 5 weekly active accounts. Only the energy office and the vendor engineer log in. If operations does not look, the reports are not answering their question.
Fix points and collection first. Those are data-layer faults, and they travel down the chain and contaminate every conclusion after them.
2. Why "delivered" equals "unused"
The project delivered a system, not a job. Acceptance covers servers, gateways, point counts and SCADA screens; no line item is called "energy manager." When the project team leaves, maintaining points, issuing the report and chasing exceptions lose their owner. The system runs on; nobody answers for its numbers.
The point list belongs to the project, not to operations. Points are built once from drawings and frozen at acceptance. Meters get replaced, lines rerouted, a line added, and no one files a change. Data keeps flowing; it just no longer matches the plant.
The report is written for executives, not for the shop floor. Management reads a monthly summary; a team leader cannot see their own line. If they cannot see themselves they will not use it, and the data ends up maintained by one person.
All three point at one gap: going live is an IT project with an acceptance gate; getting used is a management project with none.
3. Organization: role, duty and appraisal must line up
Organizational work is not "stronger leadership attention." It is writing four roles into a document and into the appraisal scheme.
| Role | Duty | Appraisal metric |
|---|---|---|
| Energy manager (1 person, full or part time) | Maintain the point list, issue the daily report, dispatch exception tickets, run the monthly meeting | On-time issue rate, point completeness |
| Area energy owner (1 per area, 4 in the example park) | Respond to exceptions in the area, verify on site | Share of tickets closed within 48 hours |
| IT / automation (1 person) | Gateways, communications, interfaces, platform accounts | Data online rate, interface availability |
| Finance / management control (1 person) | Rule on definitions, run the monthly reconciliation | Report versus ledger variance ≤1% |
Put the appointment on paper. A job description plus a one-page responsibility matrix stating who does what, by when. A verbally appointed owner disappears at the next rotation.
Make the appraisal weight perceptible. Put the related metrics into individual appraisal at a weight of at least 5%. Below that, the metric is something people glance at.
Do not hang the energy manager under IT. Under IT, the appraisal becomes system availability. Under energy or production, it becomes whether consumption actually fell. This is the most common organizational mistake in these projects.
4. Data governance, part one: the point list
The point list is the foundation; if it rots, every analysis is an estimate.
Fix the naming rule first. Use a four-part pattern of area-system-equipment-purpose, for example "Workshop-1 / Compressor / Unit-1 / kWh." Ban names like "Point-1" or "AI-03"; three months later nobody knows what they are.
Define every field once. Point ID, name, area, circuit, metering object, meter serial, CT/PT multiplier, communication address, interval, commissioning date, owner.
Every change leaves a trace. Additions, removals, replacements and reroutes go through a change form signed by whoever made the change, with the list updated within 3 working days, the only reliable defence against unknown points.
The test. Point completeness at or above 98%, zero unknown points, a monthly online-rate check. The example park moved from 62% to 98% in two quarters, not through technology but by sending the unclassified list to area owners monthly to be claimed.
5. Data governance, part two: the multiplier
A wrong multiplier is the quietest and most expensive error in the system.
A common configuration is a CT ratio of 200/5, a factor of 40. Set the meter to 20 and the platform reads exactly half the real energy; annual consumption drops 50% on paper. Nothing alarms: data is continuous, the curve smooth, the report still prints. The error surfaces at year end, when the ledger turns out to be about 50% higher than the platform reading — and only then does anyone trace it back to the multiplier.
Check three places. Nameplate ratio, meter setting, platform display must agree on one sheet, signed by installer and verifier separately.
Sanity-check the magnitude. Daily kWh per meter divided by transformer capacity should sit in a plausible band, never above capacity times 24 hours. If not, suspect the multiplier before the equipment.
Re-check after every replacement. A new meter ships with a default multiplier of 1, nobody changes it, and readings come out tens of times too low.
The test. Each quarter, verify 10% of points on site with a reading error no greater than 0.5%. If one is wrong, re-check the whole batch.
6. Data governance, part three: definitions
When the same metric disagrees across reports, it is almost always a definition problem, not a data problem. Four recurring splits.
Main meter versus sub-meters. The main meter minus the sum of sub-meters leaves line and transformer losses, typically 2% to 5%. That is normal, but it must appear as its own "losses" row, never quietly absorbed.
Reading date versus calendar month. The billing read date is rarely the 1st. The platform reports on calendar months, finance on billing cycles.
Tax inclusive versus exclusive. Tariffs are quoted both ways and the difference is 13%. Mix the two and no year will ever reconcile.
Production denominator. Dividing unit consumption by goods received rather than material issued shifts the result by several percentage points.
The tool that settles this is a metric dictionary: one row per metric with name, formula, source, boundary (losses, tax), owner and version. Once frozen, every report references it; nobody writes their own.
The test. Reconciliation completes by the 3rd of each month, with platform energy within 1% of billed energy. Above 1%, a written explanation signed by a named owner is mandatory.
7. Process: daily, weekly, monthly
Daily: generated automatically, humans write only the conclusion. At 8:30 each morning the platform pushes yesterday's total energy, year-on-year change, top 5 exception points and the offline list. The human job is three lines of conclusion underneath. If this still needs manual assembly, fix the report configuration first.
Weekly: exception tickets only, 30 minutes. Opened, closed, overdue, and whose desk the overdue ones sit on.
Monthly: 60 minutes, 5 numbers that must be reviewed.
- Unit consumption (or per unit area) against baseline;
- Platform energy versus the finance ledger;
- Point online rate;
- Ticket closure rate and average closure time;
- Savings or overspend for the month, split by area.
The agenda has five fixed blocks: 5 minutes of data review, 20 minutes of variance attribution on only the 3 largest deviations, 20 minutes of chartering (one deviation, one owner, one deadline), 10 minutes reviewing last month's charters, 5 minutes of decisions. The meeting degrades into a briefing when everyone reads numbers aloud and nobody claims anything. The defence: chartering must produce a written conclusion, or the meeting does not end.
8. The 30/60/90 day path
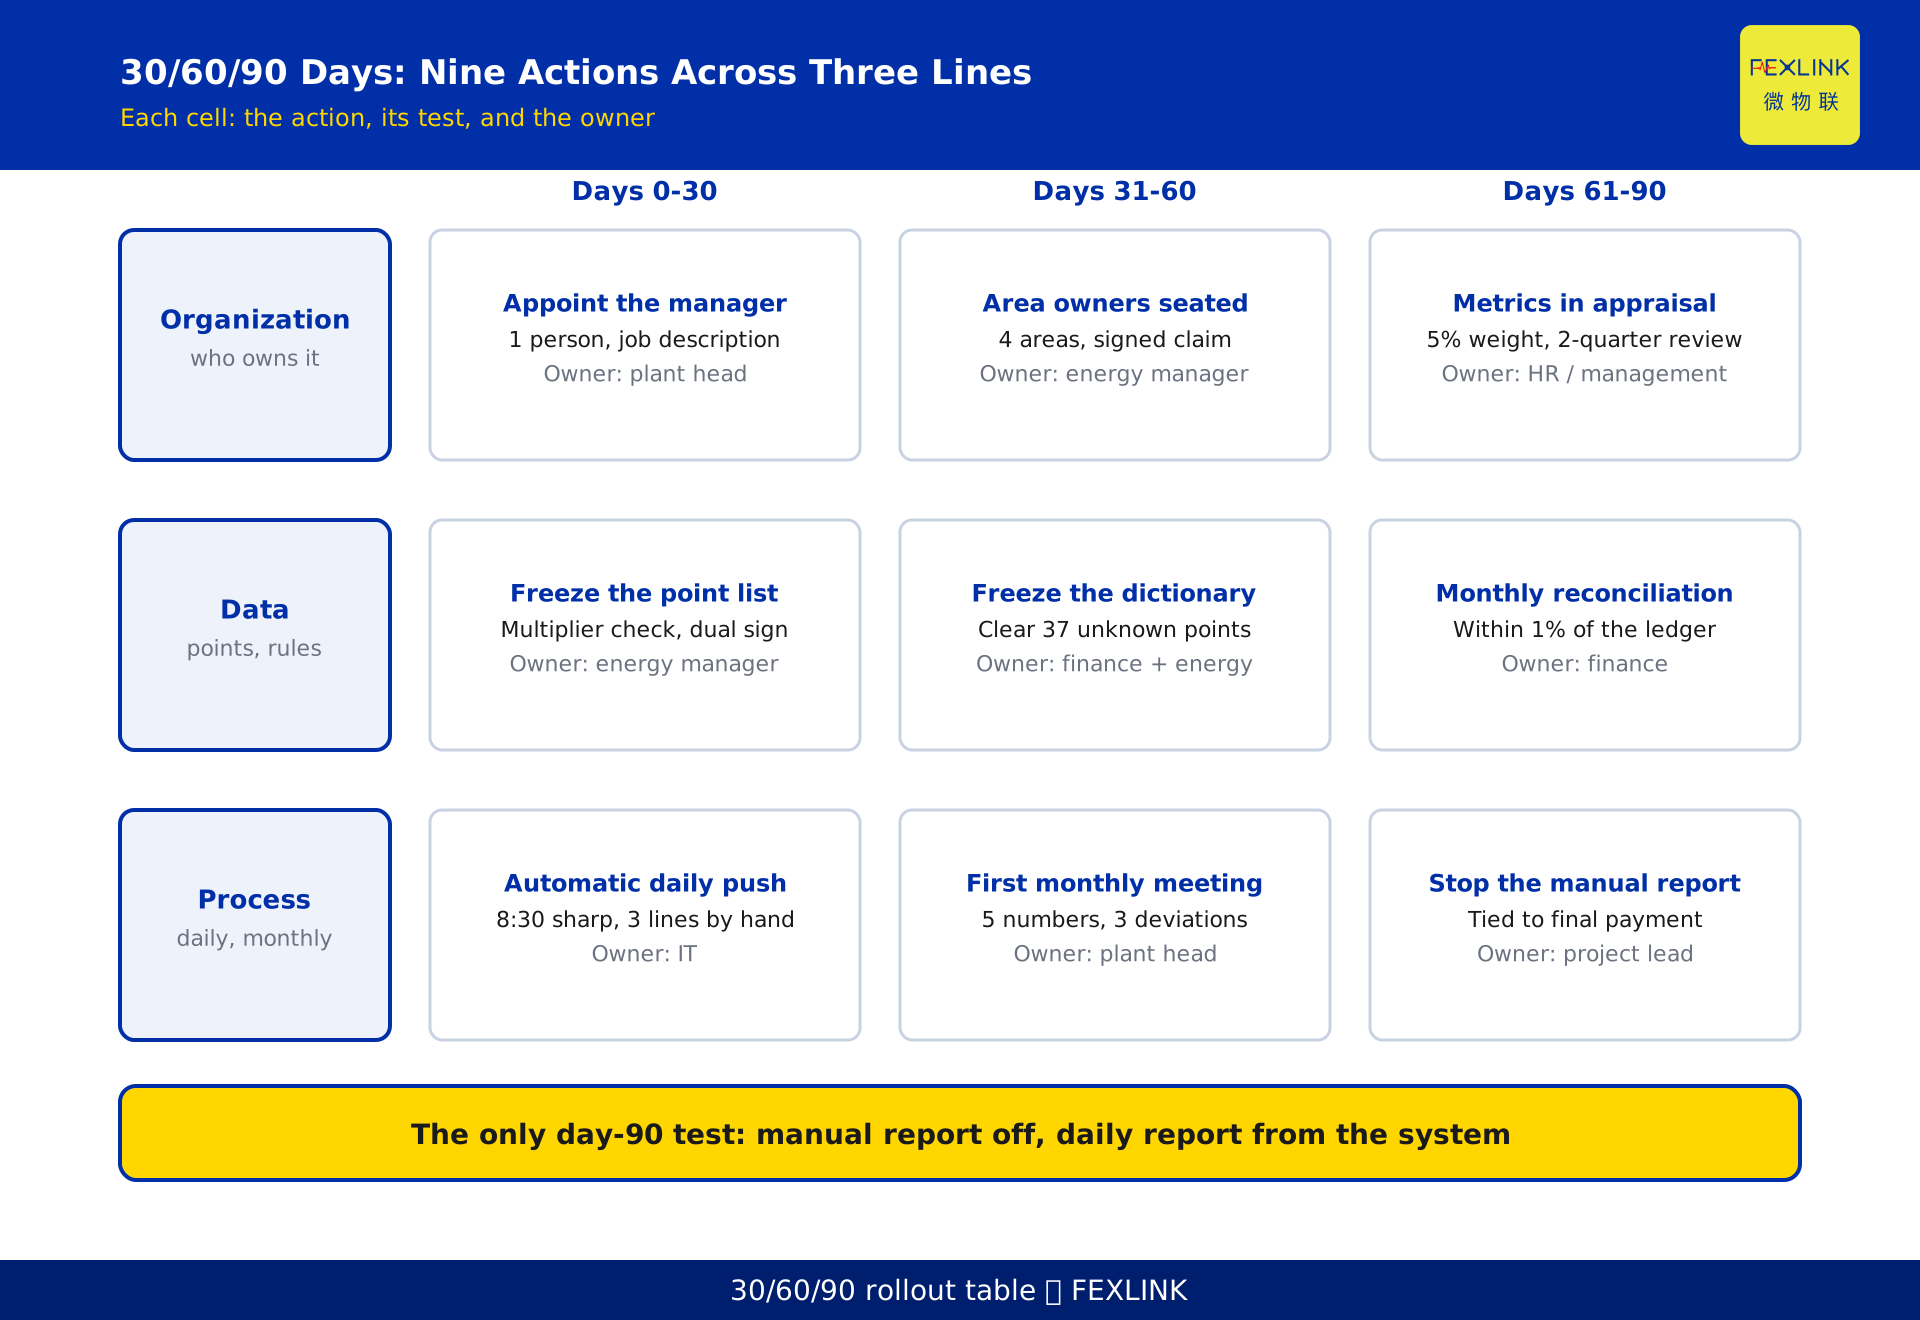
Days 0–30: lay the foundation. Freeze and verify the point list, complete the three-place multiplier check, get the automatic daily push working, appoint the energy manager. Until these four are done, everything else runs on bad data.
Days 31–60: stand up the mechanism. Freeze the metric dictionary, clear the 37 unknown points, hold the first monthly meeting, launch the ticket flow with a 48-hour limit, and get area owners to sign.
Days 61–90: stop the manual work. Put the metrics into appraisal at a 5% weight, stop the manual Excel report, run a quarterly review, and make its withdrawal a condition of final payment.
The third step is the dividing line. While the manual report survives, the platform is just another source of numbers; once it is gone, the platform is the only definition. Many projects drift at acceptance because payment was never tied to this step.
9. Where the products fit
Organization and process answer "will anyone use it"; products and platform answer "does the data arrive and reconcile." Both must be true.
Getting the data in. Field protocols are messy: meters speak Modbus RTU or DL/T 645, older equipment offers only 4–20 mA, every PLC vendor differs. The ESX intelligent edge computing gateway (ESX-0223-GR, RS485 downstream, Ethernet or 4G upstream, up to 30 devices and 2000 data points per unit) converts protocols and buffers locally during outages. A brief network hiccup should not leave a hole in the curve; one hole discredits that day's report.
Keeping points under control. FEXCloud IoT cloud platform covers device access, time-series storage and analysis. What matters is not feature count but whether points can be managed as master data: bulk import and export, field-level change history, group permissions by area and circuit. If points live only inside a SCADA screen and renaming one takes twenty clicks, the list will rot.
Never apply the multiplier twice. Set it in the meter; let gateway and platform pass values through. Apply it at both ends and readings inflate by tens of times while the curve still looks normal.
FAQ
Q: The shop floor says manual reading is faster. How should we respond?
Do not argue; look at what they actually write down. They want "what is my machine doing right now"; the platform gives a plant-wide monthly summary. Give them the area view and today's exceptions, then talk about replacing manual reading. With only a plant-wide table, they are right.
Q: Should IT or the energy office own the point list?
The energy office owns content and ownership; IT owns field formats and synchronisation. Whoever can point to the line a meter serves should own the list; a list owned by IT alone is all unknown points within six months.
Q: The multiplier was wrong for six months. Can the history be saved?
Yes, on two conditions: the wrong multiplier was constant, and raw readings were not overwritten. If both hold, recompute and tag the data with a version. If not, restart from the correction date and mark the historical segment unusable for appraisal.
Q: The monthly meeting never happens because leadership has no time.
Compress it to 60 minutes, circulate material a day ahead, and do three things: review the 5 numbers, settle 3 deviations, approve charters. Leadership need attend only the 5 minutes of decisions. When a meeting will not happen it is rarely a calendar problem; the agenda holds nothing that needs deciding.
Q: Can we publish rankings without tying anything to appraisal?
For three months, yes; long term, no. Publishing solves awareness; appraisal solves priority. Without a weight, the first thing an area owner drops when busy is the energy exception. Start with a 5% weight, review after two quarters.
Scope and limitations
- This applies to energy monitoring centres and energy management platforms built or under construction, from a single plant to a park. It does not apply where only a main meter exists and no sub-metering is in place; add metering first, then talk about governance.
- The organizational and appraisal sections touch HR systems. This is a minimum viable structure; weights and roles must align with the existing scheme.
- The figures used here — 98% point completeness, 1% reconciliation variance, 0.5% sampling error, a 48-hour ticket limit, a 5% appraisal weight — are engineering practice recommendations, not mandatory values from any standard.
- The example park (62% to 98% point completeness, 37 unknown points, a 4.2% reconciliation gap) is a constructed and anonymized illustration, not a real customer or project.
- Model numbers and parameters for the ESX gateway and FEXCloud platform follow the latest selection manual and product knowledge base; nothing here is a procurement recommendation.
Frequently Asked Questions
The shop floor says manual reading is faster. How should we respond?
Do not argue; look at what they actually write down. They want "what is my machine doing right now"; the platform gives a plant-wide monthly summary. Give them the area view and today's exceptions, then talk about replacing manual reading. With only a plant-wide table, they are right.
Should IT or the energy office own the point list?
The energy office owns content and ownership; IT owns field formats and synchronisation. Whoever can point to the line a meter serves should own the list; a list owned by IT alone is all unknown points within six months.
The multiplier was wrong for six months. Can the history be saved?
Yes, on two conditions: the wrong multiplier was constant, and raw readings were not overwritten. If both hold, recompute and tag the data with a version. If not, restart from the correction date and mark the historical segment unusable for appraisal.
Can we publish rankings without tying anything to appraisal?
For three months, yes; long term, no. Publishing solves awareness; appraisal solves priority. Without a weight, the first thing an area owner drops when busy is the energy exception. Start with a 5% weight, review after two quarters.