 FEXLINK Research Institute
The short answer
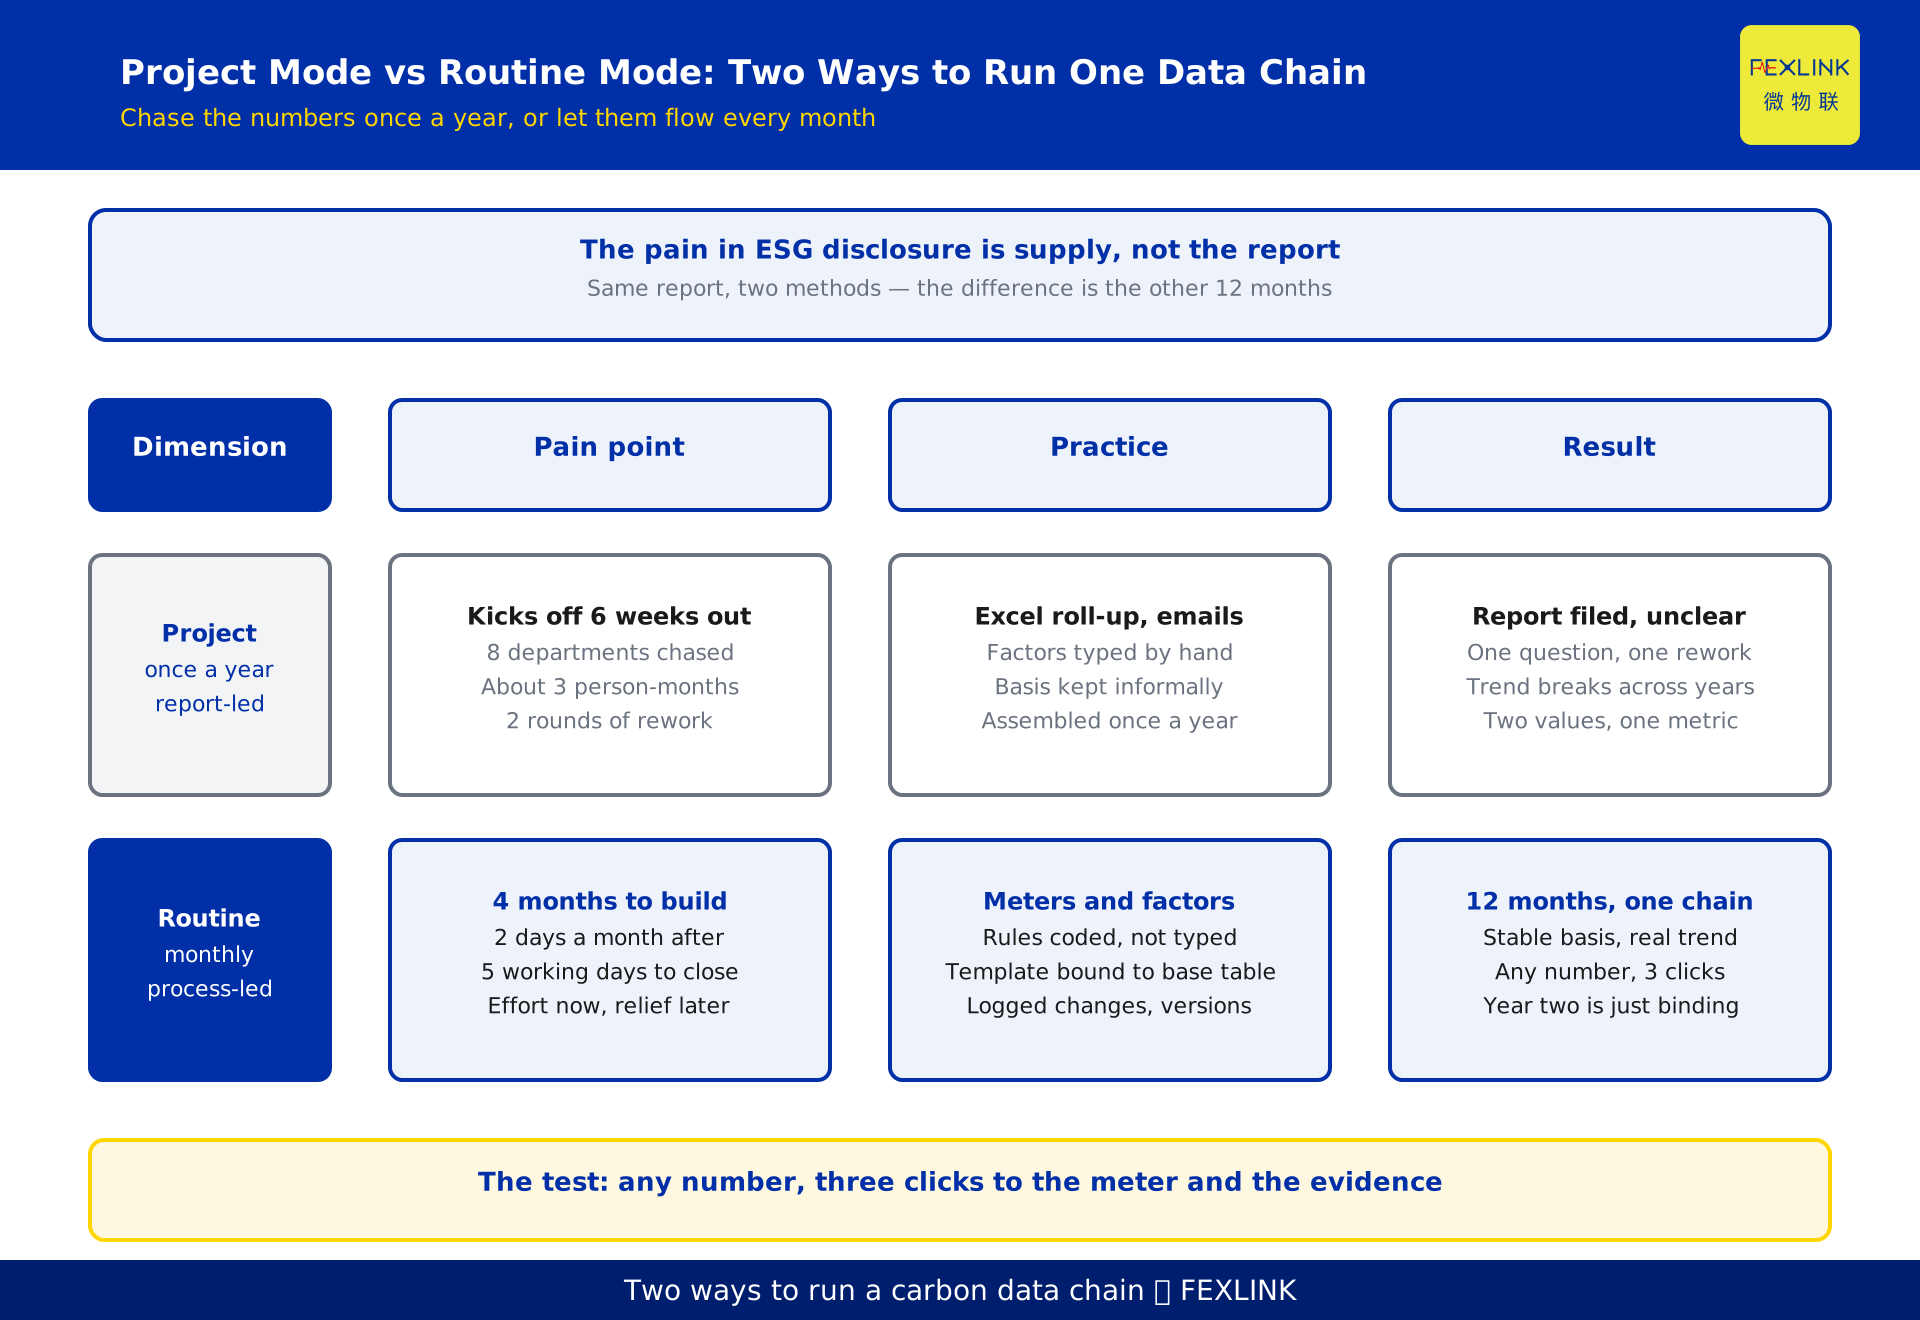
Three terms. ESG covers environmental, social and governance issues — the non-financial topics a company is asked to report on. Carbon disclosure is the hardest item inside the "E": what is required is not a narrative but numbers somebody else can re-perform — how much was emitted, where the boundary sits, how the figure was produced. The difference between project mode and routine mode is one line: in project mode the hunt starts when a report is due, once a year, across seven or eight departments; in routine mode the numbers arrive every month, and the report is just that data bound into a pack.
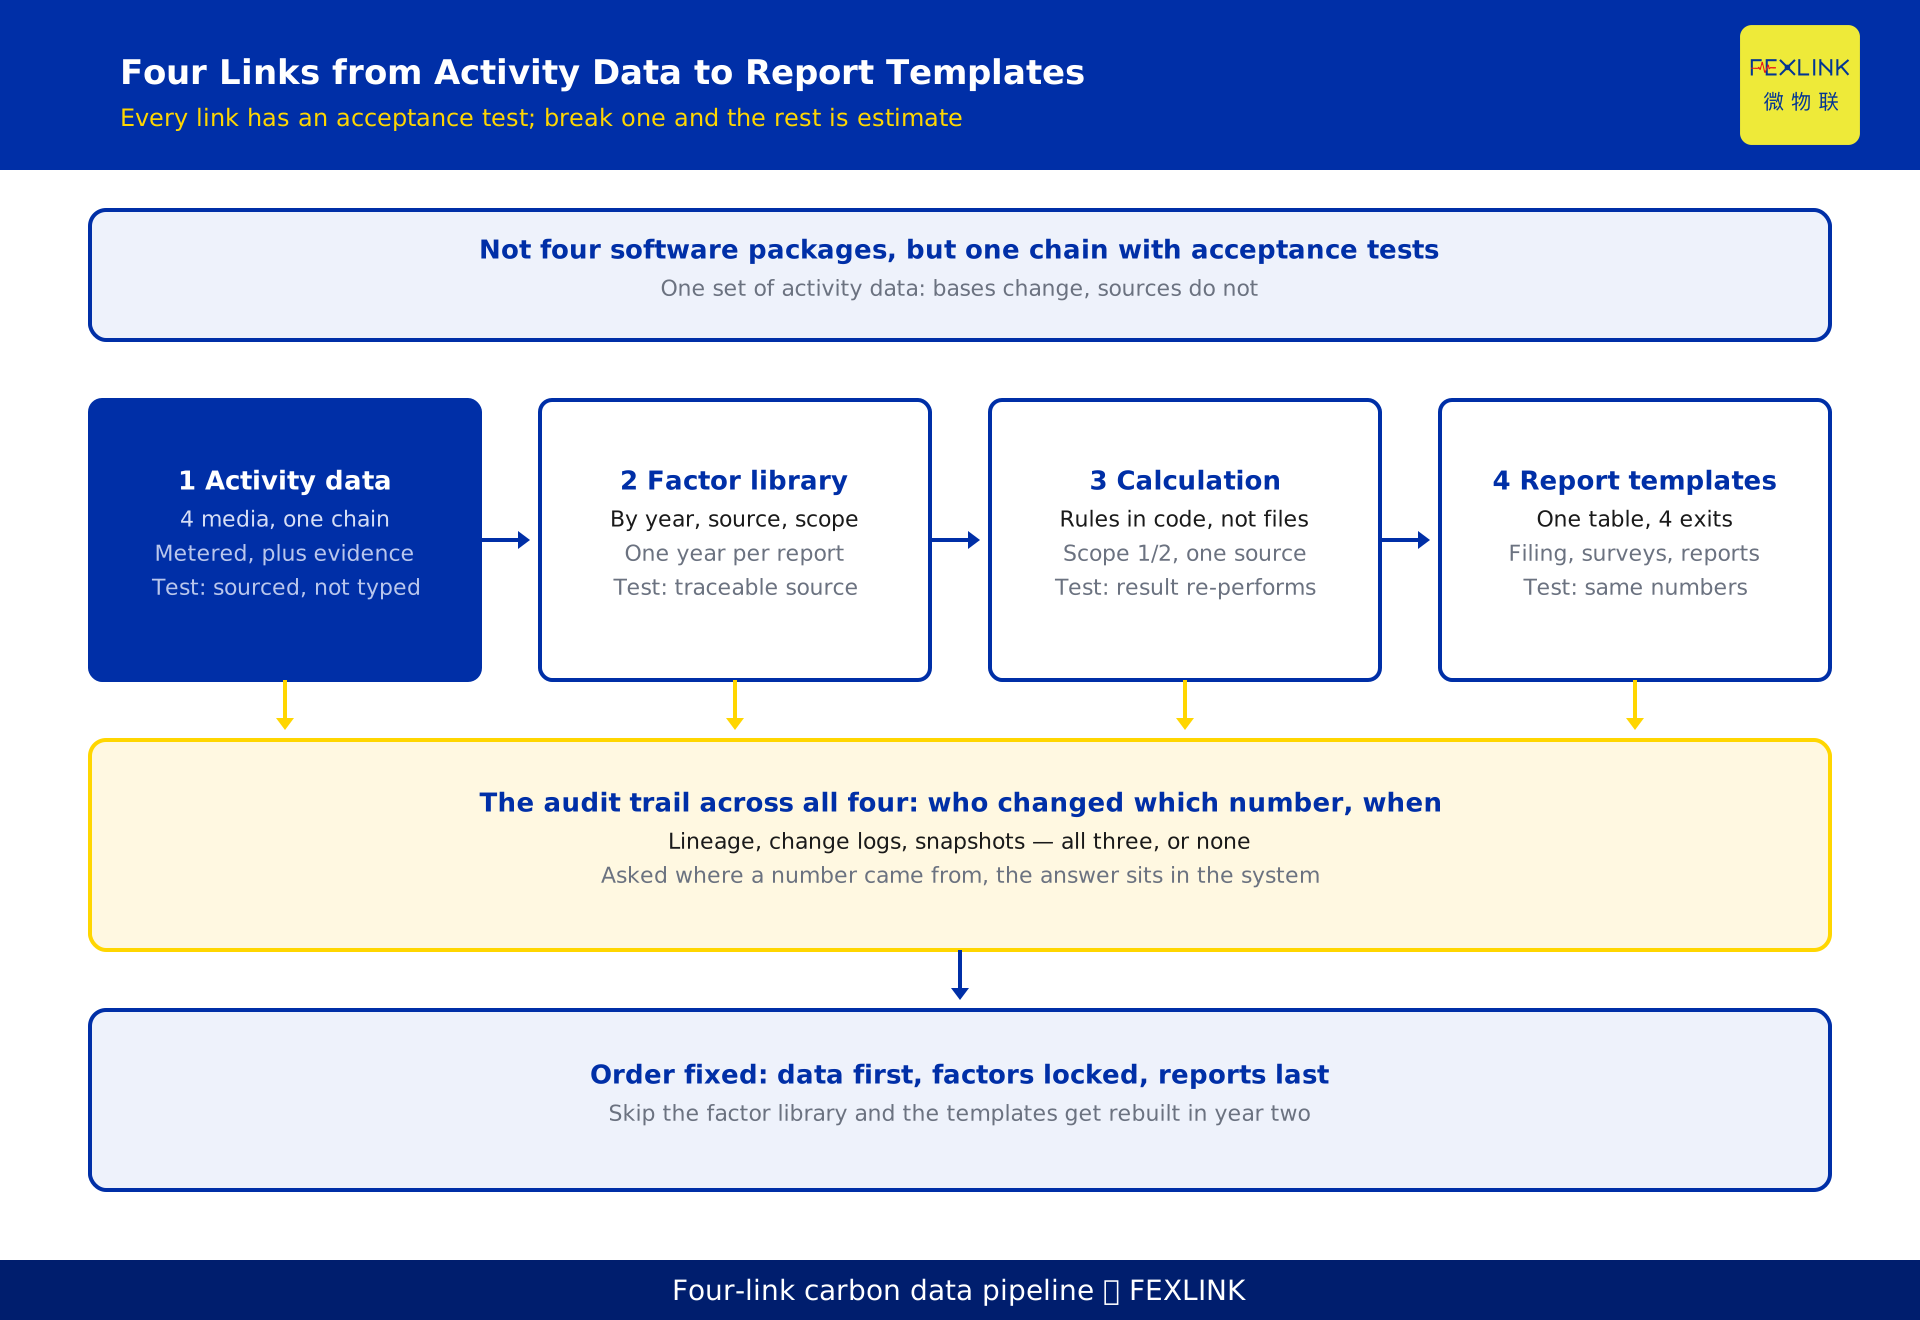
The conclusion: build a carbon data hub of four parts — automatic activity-data capture, a factor library, calculation rules, report templates — so disclosure becomes a process instead of a project. The test is blunt: pick any number in the report and see whether three clicks reach the meter, the invoice and the factor version behind it. If they do, you have a system; if not, a project.
1. What ESG disclosure actually asks for
The "E" splits into climate, energy, water and wastewater, waste, and biodiversity. Carbon is the only one with an internationally harmonised method, and that has a side effect: the numbers must be reproducible. Narrative can stay vague; an emission figure cannot, because it is activity data multiplied by a factor, and both need a documented source.
The demands arrive through four exits.
| Exit | Who asks | What they want | Cadence | Most often missing |
|---|---|---|---|---|
| Regulatory filing | Environmental, statistical authorities | Emissions, energy use, method | Annual | Evidence, factor year |
| Carbon market | Regulator, verifier | Emission report, ledger | Annual | Meter register, calibration |
| Customer questionnaires | Brand customers, platforms | Scope 1/2/3, targets | Annual, quarterly | Boundary, sources |
| Ratings | Agencies, investors | Intensity, trend, governance | Annual | Three years, one basis |
The four exits want largely the same thing: one set of activity data, one boundary, one factor version. So the design is one base table with four exits, not four reporting systems.
2. Project mode versus routine mode: what happens across 12 months
Most companies count the weeks spent writing the report and forget the weeks before it: work starts six weeks ahead of the deadline, eight departments are chased at once, one cycle costs about three person-months and two rounds of rework.
Basis drift. Which grid factor was used for Scope 2 last year, and whether the boundary included a new workshop — nobody remembers twelve months later. The same line can show a 20% intensity change when only the basis moved.
History that cannot be reconstructed. A verifier asks where a number came from, and the answer is a spreadsheet belonging to somebody who has left. What cannot be rebuilt is the past.
Routine mode spreads the cost: four months to stand the system up, then two days a month for collection and review, five working days to close the annual report. What matters is not the saving but that a basis only stabilises when the same data chain runs for twelve consecutive months. One test decides it: can this year's report be recalculated with last year's rules, with every difference explained?
3. The architecture: four links and one audit trail
Four links, order fixed. The activity data layer answers "what happened"; its keyword is source evidence — every entry has a meter record or settlement document. The factor layer answers "where does the ratio come from": power, fuel and fugitive factors, each with a year, a publisher and a scope. The calculation engine answers "how is it computed": boundary attribution, unit conversion, allocation, rounding — rules that belong in the system, not in one person's workbook. The exit layer answers "who sees what": disclosure templates, compliance reports, questionnaires and dashboards, all mapped from the same base table.
Running across all four is traceability. Without it, the other layers only look like they hold numbers; the design starts with the acceptance artefact for each link.
4. Collecting activity data automatically
Activity data falls into two families. Metered data — electricity, water, gas, steam — can be captured automatically. Document data — fuel settlements, raw-material purchases, transport distances, refrigerant top-ups — mostly needs manual entry, but can carry an audit trail. Four questions follow.
Are there enough points? With only an incoming main meter you can compute a total but cannot allocate to workshops or products. The working criterion: cover the main energy systems to 80% or better before talking about a system.
Is the timestamp consistent? Mixing settlement kWh with meter-read kWh, or double-counting the last days of a month, is the most common systematic error in carbon data. The capture timestamp must align with the reporting basis, and that must be written into policy.
How do non-electric media get in? Gas, steam and water each have their own meters and protocols. Normalise at the edge first — one timestamp, one unit, one quality code — then transmit. Sub-circuit electricity can be captured with the ESA full-parameter smart meter (ESA-22111-R through ESA-22161-R, six current ratings, 3×220/380V, RS485 Modbus) so consumption becomes remotely readable; gas, steam and water join the same chain through pulse or Modbus.
Where does the evidence hang? Each month's data must carry its invoice, settlement sheet or calorific-value report, and the capture layer needs data quality rules — completeness, timeliness, plausibility, consistency — so a missing point is flagged in the month it happens.
5. The factor library and the calculation engine
Factors are the easiest part to get wrong: one report containing factors from three different years, because three people filled three tables.
A factor library manages three things. Version — each factor has an effective year, a publisher and a scope, and any switch is logged. Source — regional grid factors, fuel net calorific values and GWP values for fugitive gases cannot be mixed across sources. Locking — one factor set is locked at the start of a reporting period; if it must change, the change goes through a workflow and the impact is quantified.
The engine does four things: unit conversion, boundary attribution, allocation, precision and rounding. Once these live in code, one set of activity data yields one result however many reports come out of it.
Align with the standards, but do not conflate two levels. ISO 14064-1:2018 addresses organisational-level greenhouse gas quantification and reporting — boundary, categorisation, report content. ISO 14067 addresses the product carbon footprint from a life-cycle perspective: how much one product emits from cradle to gate. An organisational figure cannot be used directly as a product figure. Domestic filing aligns with GB/T 32150, current edition the 2025 version (effective 2026-07-01, replacing the 2015 version).
Tianyan E-09 (carbon accounting) covers the factor library and automatic calculation: the library updates by version, activity data is converted by rule on entry, reports come from templates. It replaces manual spreadsheet calculation, not accounting responsibility — boundary and allocation still need a company signature.
6. Report templates and traceability
A template is not a Word file but a field mapping table: base-table fields on the left, the fields each exit requires on the right, conversion and retrieval rules in between. Get it right and a report means selecting a period and exporting; get it wrong and every cycle starts with re-mapping fields.
Traceability needs three components. Data lineage — every aggregate drills to detail, and detail to a meter reading or scanned document. Change logging — who changed which number, when, from what to what, and why. Version snapshots — data is frozen when a report is published, so the published report stays reproducible however the base table moves afterwards.
Explaining three years later why 2026 intensity is below 2025 depends on these three.
7. The operating rhythm: monthly, quarterly, annual
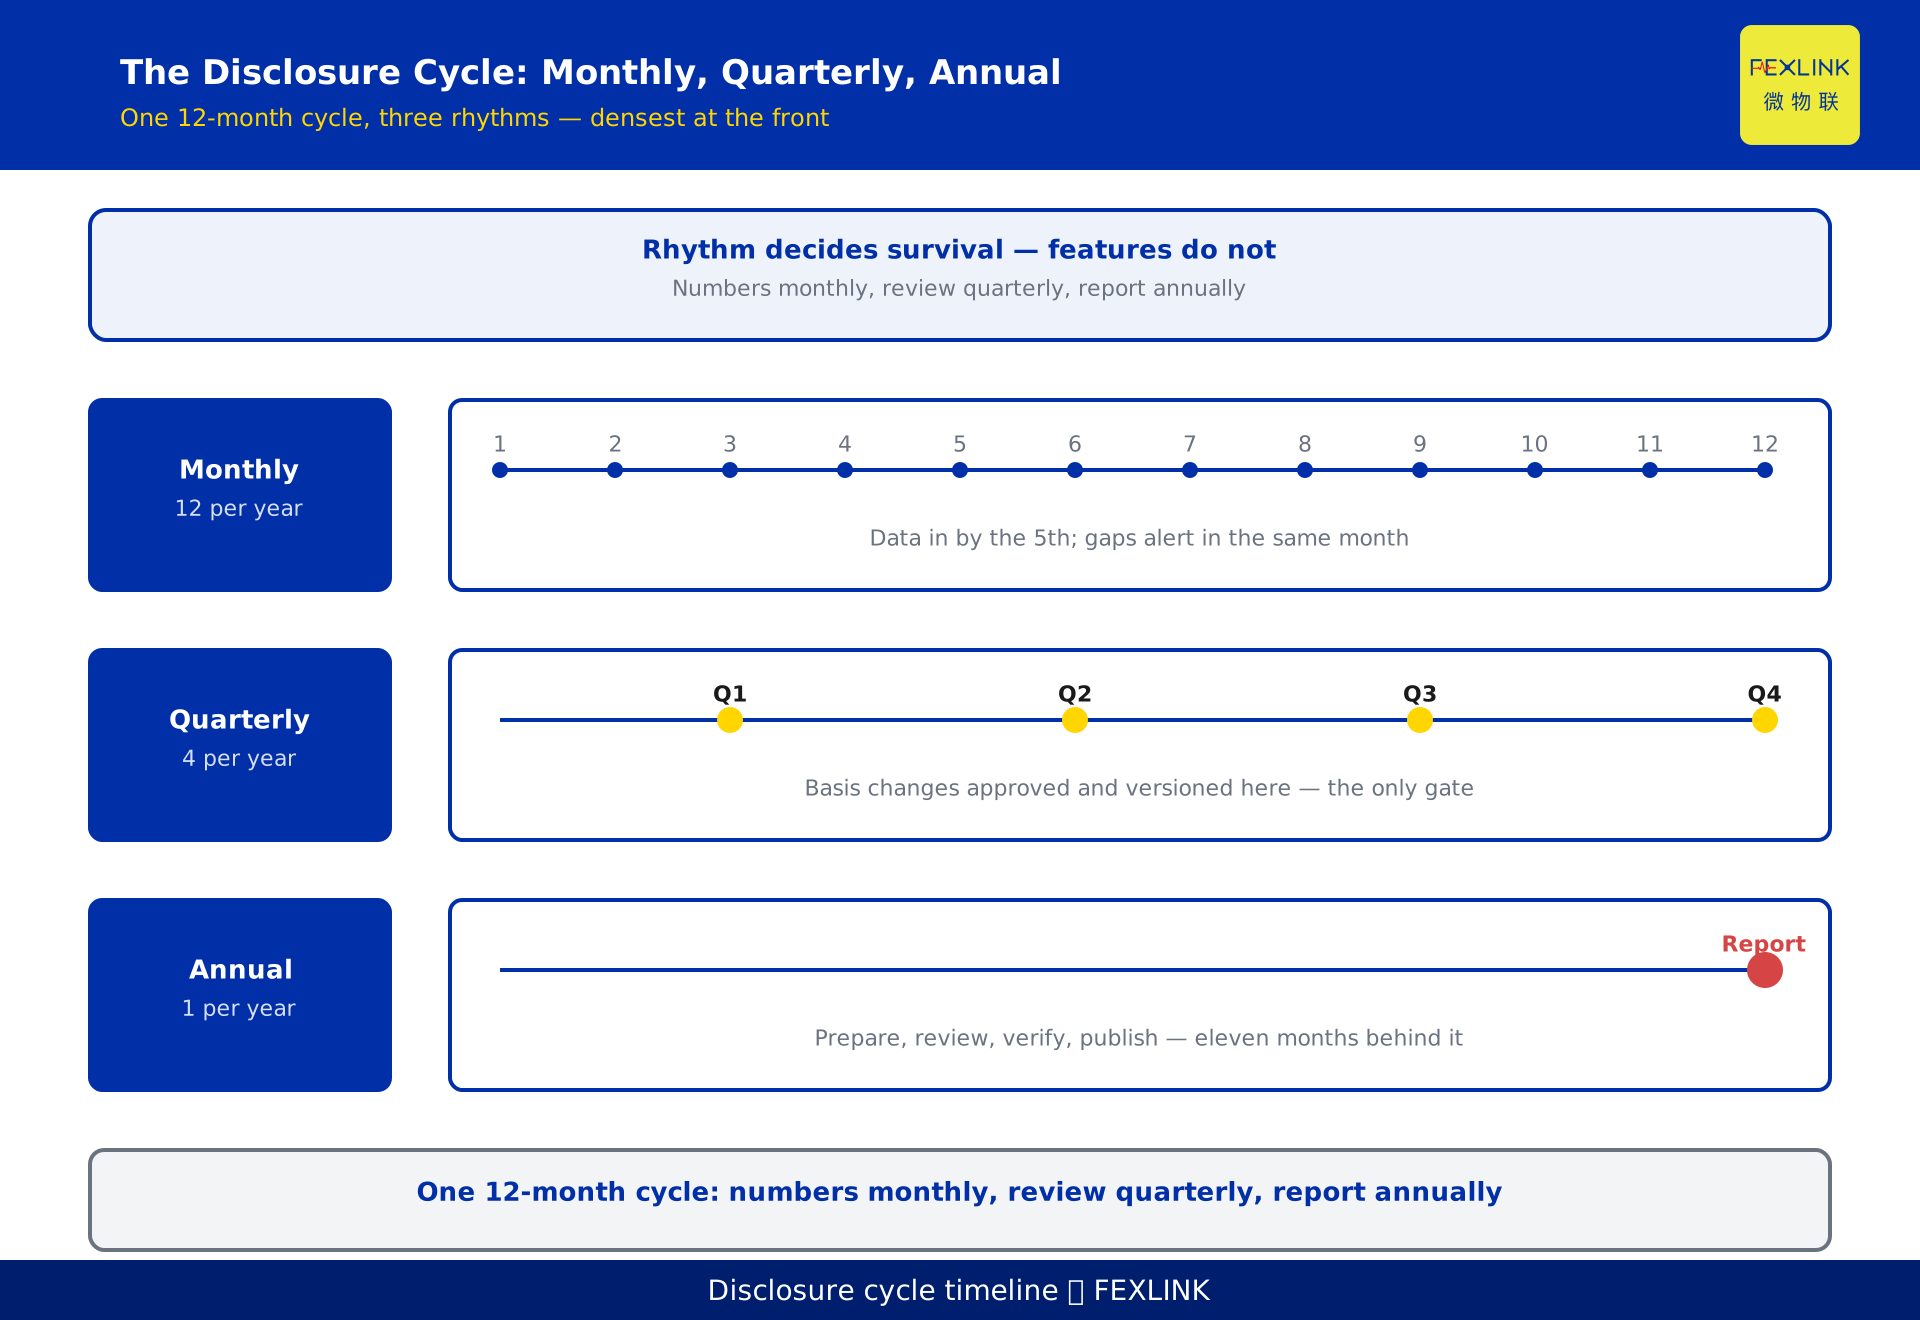
Monthly collection (12 times a year). Data lands within T+5, missing points raise an alert, the data owner backfills and attaches evidence. No conclusions monthly; the goal is complete and correct numbers.
Quarterly review (4 times a year). The accounting owner runs a quick calculation against the previous quarter and the same quarter last year. Any basis change is approved here and versioned — the only gate that stops a change being discovered in December.
Annual disclosure (once a year). Prepare, review internally, verify externally, publish. Because the previous eleven months have been running, the annual action reduces to binding. Name three roles — data owner for the truth of the numbers, accounting owner for method and basis, disclosure owner for external messaging. One person can hold all three, but the names cannot be blank.
8. A constructed example: planning year one
A constructed example illustrating the design; it represents no real customer.
A manufacturer with three sites and nine workshops had only incoming main meters and assembled its carbon data once at year end.
Months 1–3: inventory 64 metering points across three tiers — incoming, workshop, major equipment — and bring four media (electricity, natural gas, steam, water) into one capture chain. Build the activity-data ledger with fixed fields: period, point, medium, quantity, unit, evidence number, capture method. Months 4–6: build the factor library with three versions, each tagged with publisher and scope; configure the engine for Scope 1 and Scope 2 on the ISO 14064-1:2018 categorisation, leaving Scope 3 fields present but empty. Months 7–9: build the templates, map all four exits to the base table, and ask internal audit to sample 20 numbers against the "any number, three clicks" test.
Months 10–12: enter the routine rhythm — one monthly cycle, one quarterly review — and close the first full report. Annual purchased electricity is around 48 GWh and natural gas around 60,000 cubic metres; those figures indicate magnitude only, because the emission result depends on the factor year.
The measure that matters is not how thick the report is, but how many person-days the same report takes in year two.
Frequently asked questions (FAQ)
Q: We only report to head office. Do we need all this?
Yes, but you can shrink it. The criterion is disclosure frequency multiplied by the number of exits. With one exit, a structured base table plus a locked factor set is enough. With two or more, manual mapping costs more in rework than building the system.
Q: Should we tackle Scope 3 now?
Leave the fields, do not rush the numbers. Scope 3 depends on supplier data, has long collection cycles and contested boundaries, and in year one usually produces estimates built on estimates. Make Scope 1 and 2 solid first, define the category list and data ownership, then start with one or two obtainable categories in year two.
Q: Factors change every year. Should history be recalculated?
Do not recalculate, but keep two sets. Published reports stay as they were, archived under the basis of that time; internal trend analysis can use the latest factors. Quietly editing history costs far more to explain than maintaining two sets.
Q: We already have an energy monitoring platform. Do we build another?
No — you add the factor layer, the calculation rules and traceability. An energy platform answers how much was used; a carbon data system also answers where the ratio came from, how the boundary was drawn, and who changed a number. If the platform can expose interfaces, hold factor versions and keep change logs, build on it; if not, keep the capture layer and rebuild above.
Q: How do we justify the investment to management?
Three numbers, not page counts: person-days per disclosure, rework caused by basis changes, and data findings raised by verification. All three should fall together in year two. If only the first falls, what was built is a reporting tool, not a data system.
Scope and limitations
- Applies to companies producing ESG and carbon disclosures: manufacturing, industrial parks and groups. Financial institutions and internet companies carry a higher Scope 3 share and need another category list.
- Standards cited: ISO 14064-1 as the 2018 edition, on organisational-level greenhouse gas quantification and reporting; ISO 14067 on product carbon footprints from a life-cycle perspective, a level that must not be conflated with the former; GB/T 32150 as the current 2025 edition (effective 2026-07-01, replacing the 2015 edition). No clause numbers are cited.
- No emission factor values are given. Factors change by year, region and publisher; lock the version and state the source and scope instead of copying a number.
- Where the system must also output energy indicators: the electricity equivalent value is 0.1229 kgce/kWh (fixed in GB/T 2589-2020); the equivalent-value basis uses the previous year's national thermal power supply coal consumption, recently around 0.30–0.31 kgce/kWh (indicative range, subject to the published value), not a constant.
- The figures in section 8 (three sites, nine workshops, 64 points, four media, three factor versions, 48 GWh, 60,000 cubic metres, 20 sampled numbers) illustrate the design, represent no real customer, and support no emission conclusion.
- The ESA full-parameter smart meter, Tianyan E-09 (carbon accounting), the smart energy-carbon IoT platform and the electricity-carbon coordination solution are described by capability only; models and configurations follow the latest selection manual, and range, channel count, power supply and interfaces are configurable items.
- Division of labour with KD-0438 (carbon software selection): KD-0438 covers how to choose carbon software, this article how to build the carbon data system.
Frequently Asked Questions
A Carbon Data System for ESG Disclosure
Three terms. ESG covers environmental, social and governance issues — the non-financial topics a company is asked to report on