 FEXLINK Research Institute
The short answer
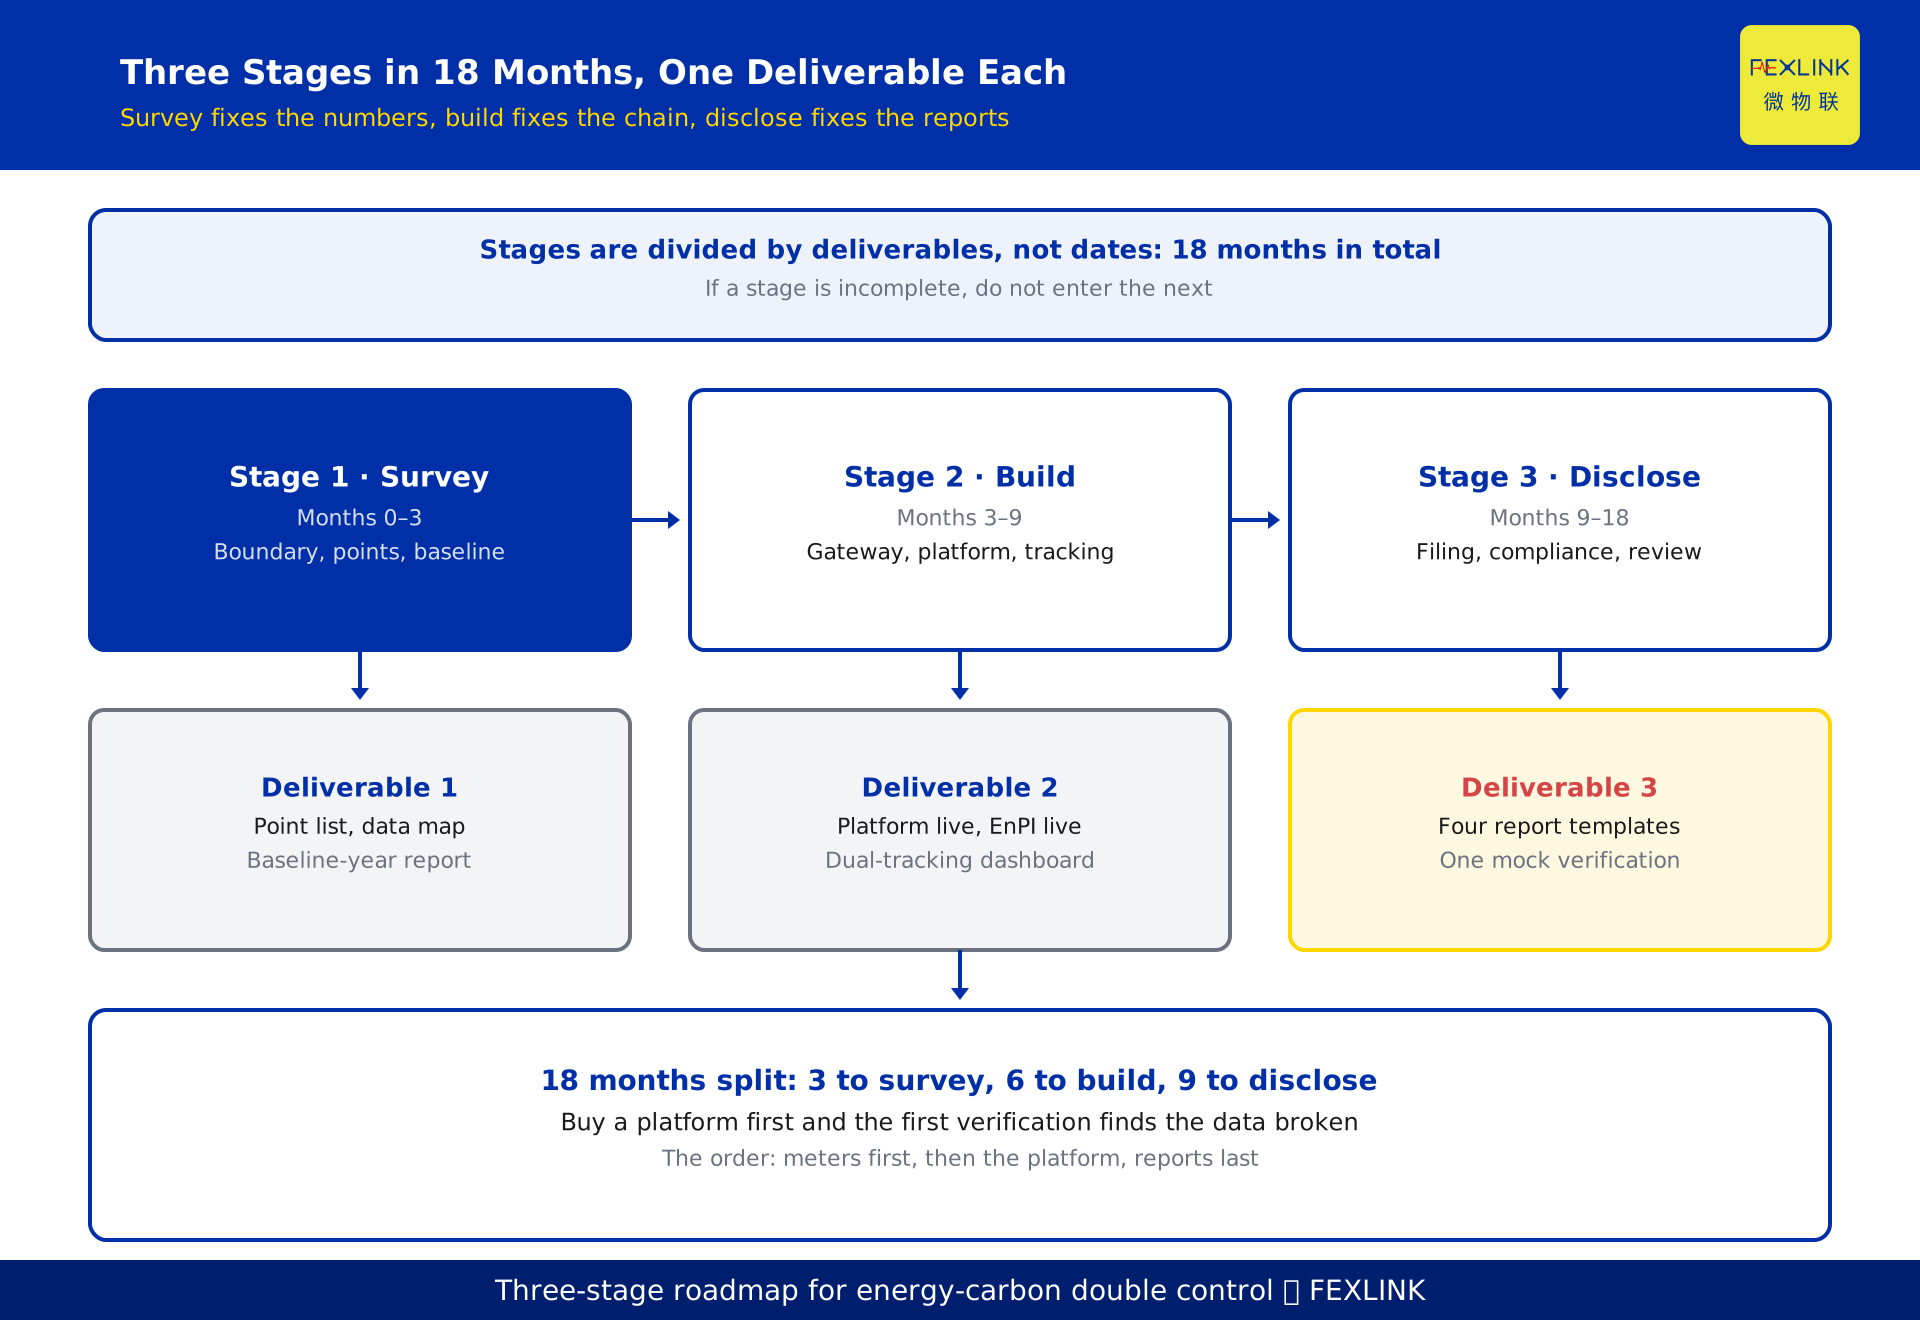
Decode the term first. Energy-carbon double control is two indicator sets stacked together: the energy side governs total energy consumption and energy intensity, the carbon side governs total emissions and carbon intensity. The numerators differ — tonnes of coal equivalent versus tonnes of CO2 equivalent — and a conversion layer sits between them. The conclusion: a high-emission plant does not need one large system installed at once. Run three stages — survey, build, disclose — standing up the metering base, the energy-carbon platform and paired EnPI/carbon tracking over 12 to 18 months. The test: if a stage's deliverables are incomplete, do not enter the next. Plants that buy a platform first usually find at first verification that the data does not connect.
1. What changed: same source data, one more conversion layer
Energy double control asks how much energy was used, and how much per unit of output. Carbon double control asks the same about emissions. The difference is the middle layer: energy converts to coal equivalent under GB/T 2589, carbon is activity data times an emission factor.
That is why so many plants hold complete energy data and no carbon data: meters record kilowatt-hours but not carriers, and the ledger holds a total but no breakdown.
The policy direction is settled. In 2024 the General Office of the State Council issued the Work Plan for Accelerating the Construction of a Carbon Emission Double-Control System (Guobanfa [2024] No. 39), pointing toward a gradual shift from energy double control to carbon double control; provisions and timing follow the text in force. One sentence matters to a plant: the assessment point will widen from tonnes of coal equivalent to tonnes of CO2, while the data source stays the same — the same meters, one body of activity data supporting two indicator sets.
2. Compliance pressure lands on four pieces of paper
| Channel | Who asks | What they want | Cadence | Usually missing |
|---|---|---|---|---|
| Energy review and inspection | Energy authority | Energy use, efficiency, saving measures | Milestone / annual | Sub-metering and equipment register |
| Annual energy use report | Statistics and energy authority | Comprehensive consumption, fuel mix | Annual | Conversion basis, carrier detail |
| Carbon market compliance | Ecology and environment authority | Emission report and verification | Annual | Activity data evidence, factor vintage |
| Customer and ESG questionnaires | Customers, rating agencies, investors | Scope 1/2/3 emissions, reduction measures | Annual / quarterly | Boundary statement, data sources |
What the four ask for overlaps heavily: traceable activity data, a basis that can be written down, a consistent boundary. So the system need not be four systems; one base table with four exits is enough. When a document fails, the cause is almost always a number with no source behind it.
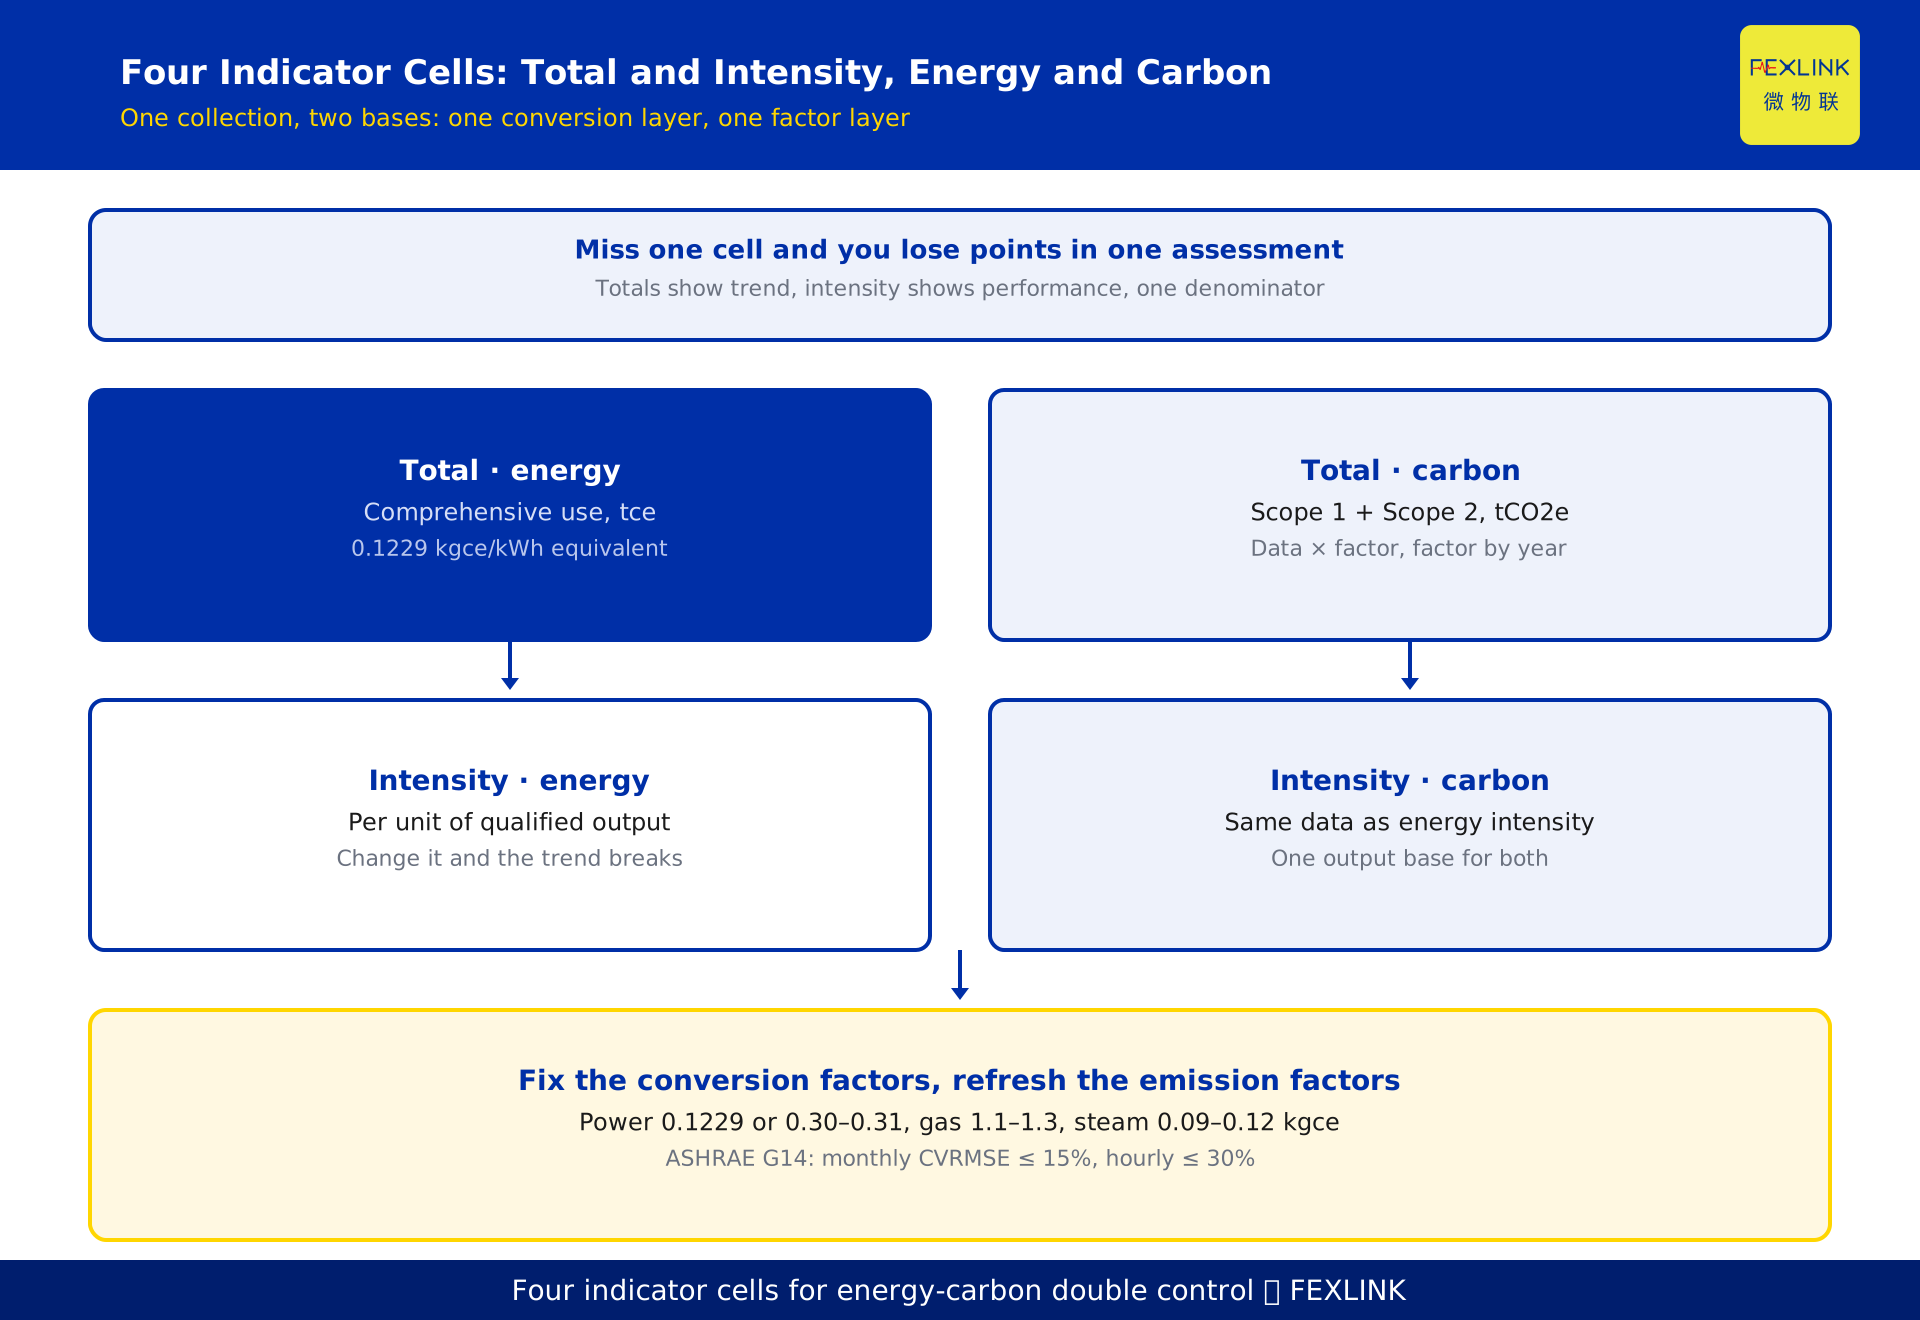
3. Pairing indicators: four cells from EnPI and carbon metrics
GB/T 23331, the national energy management systems standard, is identical to ISO 50001. It supplies a method rather than a checklist: energy review, energy baseline, energy performance indicators (EnPI), performance improvement. The carbon side reuses the same skeleton, so both sets share one review, one baseline and one improvement ledger.
The pairing yields four cells, and missing one costs points somewhere: total × energy (comprehensive consumption, tce), total × carbon (total emissions, tCO2e), intensity × energy (consumption per unit of product), intensity × carbon (emissions per unit of product).
The conversion basis must be fixed in writing: the electricity equivalent value is 0.1229 kgce/kWh (GB/T 2589-2020); the coal-equivalent value uses the previous year's national average coal consumption for thermal power supply, recently around 0.30–0.31 kgce/kWh (illustrative; use the published figure); natural gas is commonly 1.1–1.3 kgce/m³; steam follows actual enthalpy at roughly 0.09–0.12 kgce/kg; and carriers such as fresh water, compressed air, oxygen and nitrogen are counted too.
On the carbon side, activity data is multiplied by an emission factor updated annually. No factor value is given here — it changes with year and grid boundary, and copying a number into a report is more dangerous than omitting it. The rule that can be fixed: within one report, one vintage, one source.
Intensity hides a trap: the denominator. Qualified output, shipped volume and revenue give very different intensities, and regulators usually accept qualified output. Change the denominator and the trend breaks. For baseline regression, ASHRAE Guideline 14 applies: monthly data CVRMSE ≤ 15%, NMBE ≤ 5%, R² ≥ 0.75; hourly data CVRMSE ≤ 30%, NMBE ≤ 10%. The hourly thresholds are looser — do not mix them. Savings verification follows GB/T 28750.
4. The three-stage roadmap: 18 months, one deliverable per stage
The stages are separated by deliverables, not calendar.
Stage 1, survey (months 0–3): a metering point list, a data map, a baseline-year report. Without them, every later indicator is an estimate.
Stage 2, build (months 3–9): the platform live, EnPI live, a dual-tracking dashboard. This stage overruns most often: equipment work, networking and data governance happen at once.
Stage 3, disclose (months 9–18): reporting templates for the four documents, an internal assessment procedure, one complete mock verification.
The stages are not a waterfall; while stage 2 runs, stage 1 is still closing gaps. But deliverables cannot be skipped: jump to a platform and you get a beautiful dashboard plus one unanswered question — which meter did this workshop's electricity come from?
5. Stage 1: make the numbers defensible (months 0–3)
Fix the boundary. Organisational boundary by legal entity or site; operational boundary by Scope 1 (fuel burned on site) and Scope 2 (purchased electricity, heat, steam). Once set, do not change it for three years, or the baseline is void.
Inventory the metering. Three classes of point: the gateway meter settling with the grid, sub-meters for workshops, lines and major systems, and equipment meters on significant users. Record four attributes — location, multiplier, communication method, reading timestamp. The timestamp is most often missed, and it decides whether the last days of a month get counted twice.
Choose the baseline year. Complete data, comparable output, no major retrofit. Picking the prettiest year is the classic error.
Four failures recur: a total meter and no sub-metering; low coverage with estimates for major systems; inconsistent timestamps; settlement volumes mixed with metered volumes, with the line loss owned by nobody. Until these are resolved, stage 2 is built on sand.
On equipment, stage 1 solves one thing: getting the numbers out. Use the ESA all-factor smart meter (ESA-22111-R through ESA-22161-R, six current ratings, 3×220/380V, RS485 Modbus) on sub-metering circuits to turn circuit consumption into instrument-grade, remotely readable data. Where meters exist but data cannot be extracted, deploy the ESX intelligent edge computing gateway first for aggregation and protocol conversion.
6. Stage 2: a platform is configured, not purchased (months 3–9)
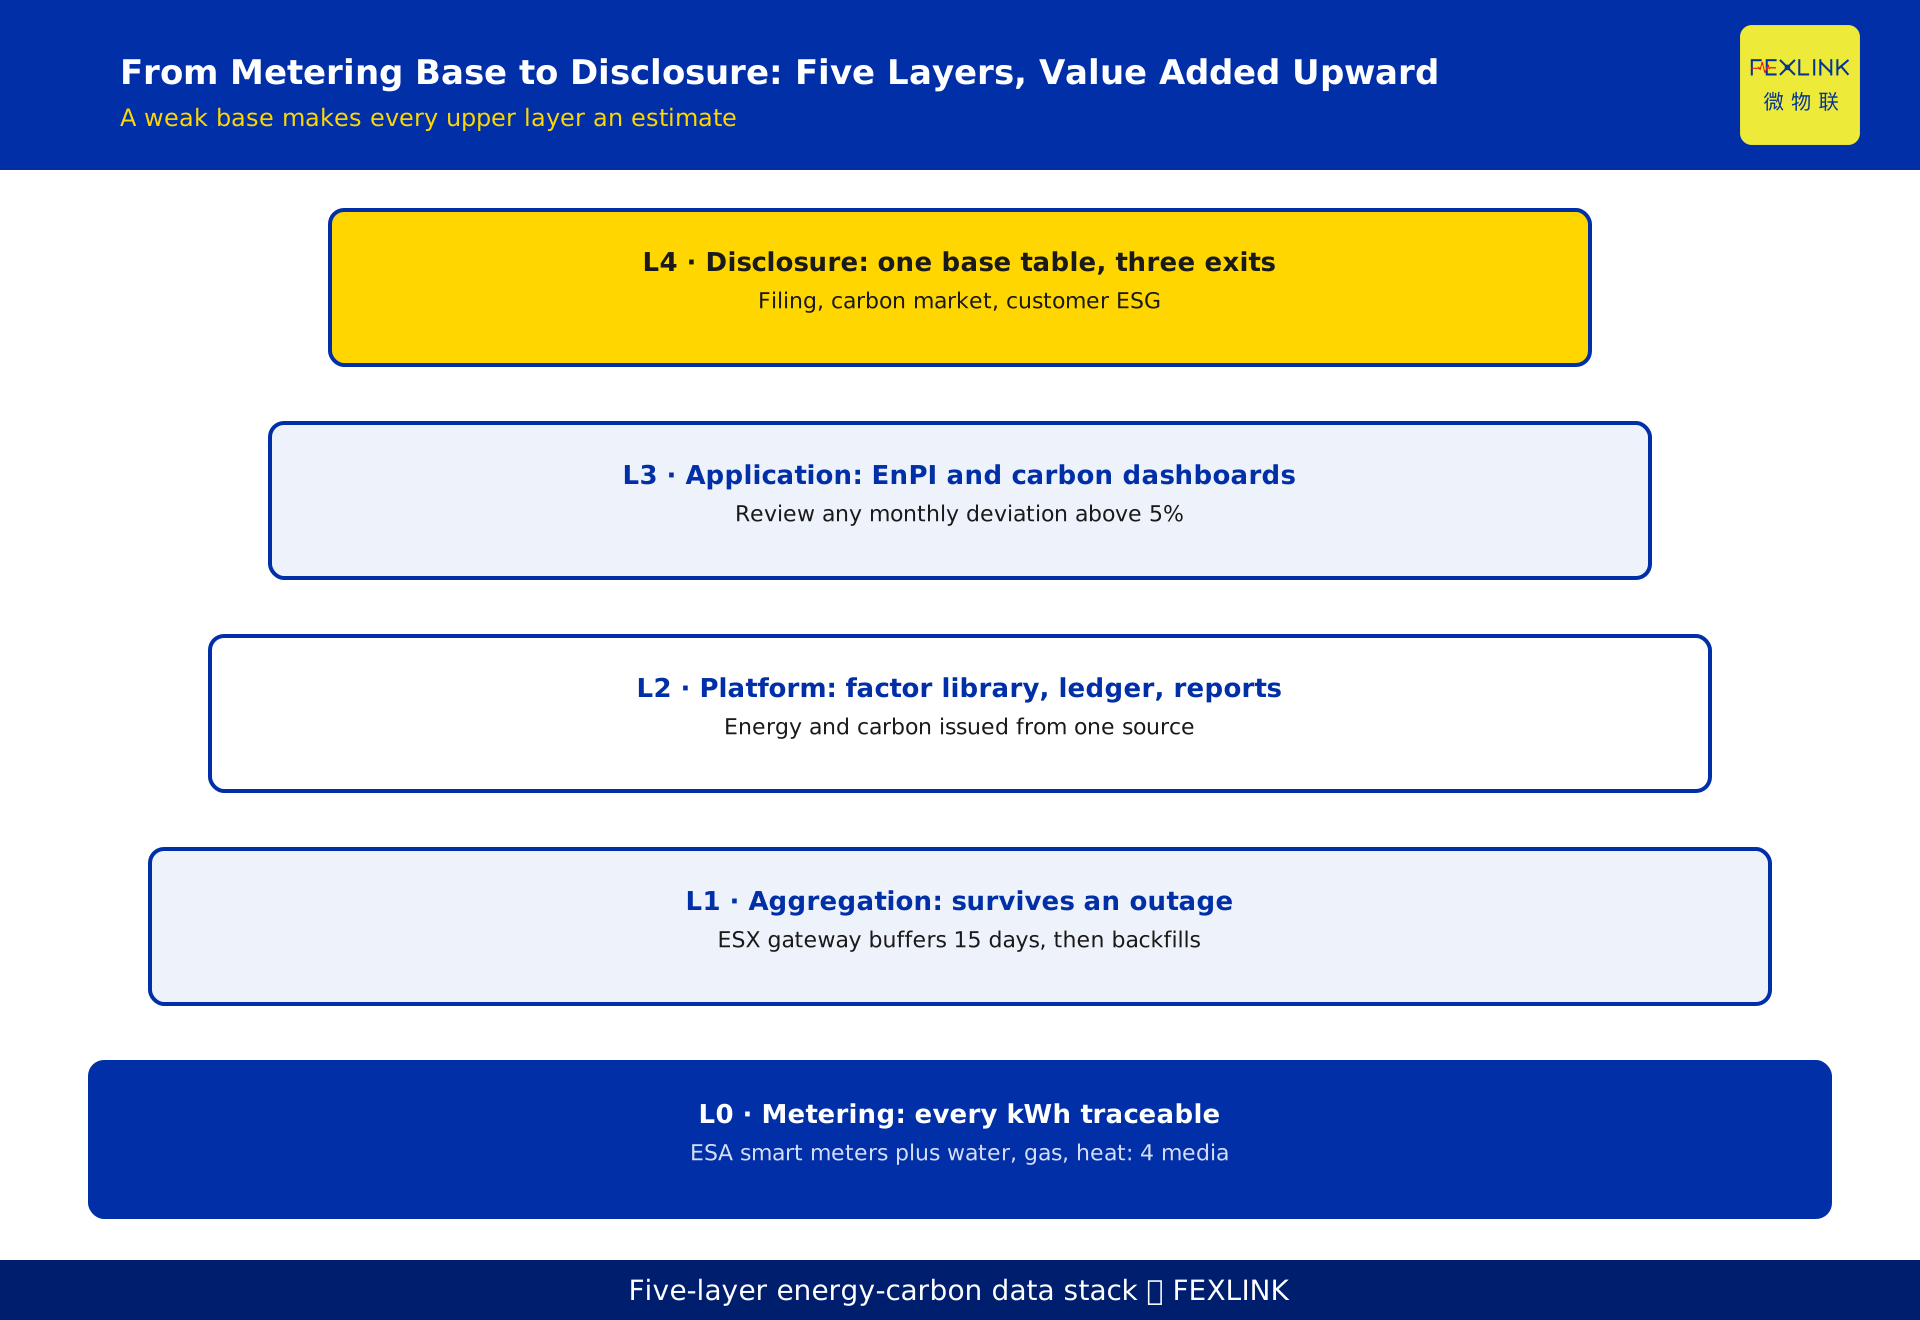
The data chain has four links: meter, gateway, platform, application.
The gateway test is whether it survives an outage. Plant networks wobble, so the acquisition layer must buffer locally and backfill after reconnection. The ESX intelligent edge computing gateway buffers 15 days locally as standard (expandable), supports Mistudio ladder-diagram programming with more than 300 instructions, and runs alarms and interlocks on site — a night-time excursion is handled locally, not by a cloud round trip.
The platform test is whether four things close the loop: a factor library with switchable vintage, source and basis; an activity-data ledger where every number has a source; EnPI and carbon calculations from the same data; reports matching the four documents. The smart energy-carbon IoT platform ships with a built-in factor library, converts consumption by carrier into carbon, and issues both reports from one source — the precondition for the two indicator sets not to contradict each other.
The application test is hierarchy. The 4×3×2 energy-carbon autonomy framework is a reference: four levels of sensing (enterprise, workshop, line, key equipment) let data drill down; three core models (safety, energy, efficiency) turn data into judgement; two response systems (saving, safety) turn judgement into action.
Judge a platform by three questions, not by its demo: can this number be recalculated, can this record be traced, can one data set produce two sets of reports? If all three hold, the platform stands.
7. Stage 3: disclosure and performance review (months 9–18)
Disclosure is not a report written at year end; it is a table filled in continuously. Three exits share one base table: government reporting wants totals and intensity, the carbon market wants emissions and allowances, customers want Scope 1/2/3 and reduction measures.
Align the accounting basis with current standards. GB/T 32150, the general rules for greenhouse gas accounting at industrial enterprises, is currently the 2025 edition (effective 1 July 2026, replacing the 2015 edition); organisation-level reporting may reference ISO 14064-1:2018. Do not use two versions of the classification in two reports — the easiest thing to catch in verification.
Performance review decides whether the system survives: break EnPI down to workshops and lines, tie it to team performance, and review any monthly deviation above 5% (a suggested threshold).
8. A worked example: how 18 months can be sequenced
Figures below illustrate the basis, not a real customer.
A plant uses 62 million kWh of electricity, 3.8 million m³ of natural gas and 42,000 t of steam a year. At equivalent values: electricity about 7,620 tce, gas at 1.2 kgce/m³ about 4,560 tce, steam at 0.10 kgce/kg about 4,200 tce, totalling about 16,380 tce. Switch electricity to 0.30 kgce/kWh and electricity alone becomes about 18,600 tce, the plant total about 27,360 tce.
Same plant, same year, 67% apart — a difference of basis, not arithmetic, and half of all disputes about the "total" figure start here.
The plant inventories three point classes in months 1–3 (two gateway meters, 46 sub-meters, 12 equipment meters), deploys gateways and goes live in months 4–9, and runs two mock verifications plus one internal assessment in months 10–18. An incomplete deliverable stops the programme.
Carbon tonnage is omitted on purpose: the factor changes with the year, and a number would mislead. The method can be given — Scope 1 is fuel times its factor, Scope 2 is purchased electricity times the grid factor, both with vintage and source.
FAQ
Q: We are not in the carbon market. Can we postpone this?
Compliance, yes; the base table, no. Customer questionnaires, supply-chain audits and green factory applications ask for the same data, and for historical years. Start with a metering inventory and a ledger.
Q: Platform first, or meters first?
Meters, but not all. The test is sub-metering coverage: get major systems (compressed air, refrigeration, motors, steam) above 80%, then bring in the platform. Below that, it is an expensive reporting tool fed with estimates.
Q: Can energy double-control indicators be reused as carbon indicators?
Not equated, but they can share a source. One coefficient for all energy is arithmetically possible and fails verification, because coal, gas and electricity carry very different factors. Share the activity data, convert separately.
Q: Equivalent value or coal-equivalent value?
Depends on the exit. Energy reviews and statistics usually use the coal-equivalent value, reflecting primary energy across society; internal benchmarking uses the equivalent value, reflecting work done. Calculate both, keep both, state which one the report uses.
Q: Eighteen months is long. Can it be compressed to six?
Yes, by cutting scope. Six months buys sub-metering of major systems, one base table, one internal report — not plant-wide sensing and dual-indicator assessment. Compress the scope, not the stages.
Q: How do we unify several plants in one group?
Unify three things: indicator definitions, conversion and factor basis, the base-table template. Once those agree, meter brands, platform versions and networks can differ by site — verification looks at the basis, not the model number.
Scope and limitations
- This article addresses energy-carbon system building for key energy-using units and high-emission plants: process industries, discrete manufacturing and self-operated park energy systems.
- Standards cited: GB/T 23331 (identical to ISO 50001, framework level only, no clause numbers, version in force governing); GB/T 2589; GB/T 28750; GB/T 32150, 2025 edition (effective 1 July 2026, replacing the 2015 edition); ISO 14064-1:2018; ASHRAE Guideline 14.
- Policy cited: Guobanfa [2024] No. 39, the Work Plan for Accelerating the Construction of a Carbon Emission Double-Control System. Only directional statements are used; provisions, coverage and timing follow the documents in force.
- Conversion factors: 0.1229 kgce/kWh is a fixed standard value; 0.30–0.31 kgce/kWh, 1.1–1.3 kgce/m³ and 0.09–0.12 kgce/kg are common ranges. Actual values follow published figures, measured enthalpy and lower heating value, and must not be applied as constants. No grid emission factor is given.
- The figures in section 8 (62 million kWh, 3.8 million m³, 42,000 t, 16,380 tce, 27,360 tce, 67%, 46 sub-metering points) are constructed to illustrate the basis and do not represent any real customer.
- Product references — ESA all-factor smart meter, ESX intelligent edge computing gateway, smart energy-carbon IoT platform, 4×3×2 framework — follow the latest selection manual. Range, channel count, power supply and interfaces are customisable, not judged against catalogue models.
- Division of labour with KD-0428 (energy performance improvement loop): this article covers a three-stage route aimed at compliance; KD-0428 covers the operating loop of continuous saving.
Frequently Asked Questions
We are not in the carbon market. Can we postpone this?
Compliance, yes; the base table, no. Customer questionnaires, supply-chain audits and green factory applications ask for the same data, and for historical years. Start with a metering inventory and a ledger.
Platform first, or meters first?
Meters, but not all. The test is sub-metering coverage: get major systems (compressed air, refrigeration, motors, steam) above 80%, then bring in the platform. Below that, it is an expensive reporting tool fed with estimates.
Can energy double-control indicators be reused as carbon indicators?
Not equated, but they can share a source. One coefficient for all energy is arithmetically possible and fails verification, because coal, gas and electricity carry very different factors. Share the activity data, convert separately.
Equivalent value or coal-equivalent value?
Depends on the exit. Energy reviews and statistics usually use the coal-equivalent value, reflecting primary energy across society; internal benchmarking uses the equivalent value, reflecting work done. Calculate both, keep both, state which one the report uses.
Eighteen months is long. Can it be compressed to six?
Yes, by cutting scope. Six months buys sub-metering of major systems, one base table, one internal report — not plant-wide sensing and dual-indicator assessment. Compress the scope, not the stages.
How do we unify several plants in one group?
Unify three things: indicator definitions, conversion and factor basis, the base-table template. Once those agree, meter brands, platform versions and networks can differ by site — verification looks at the basis, not the model number.