 FEXLINK Research Institute
The short answer
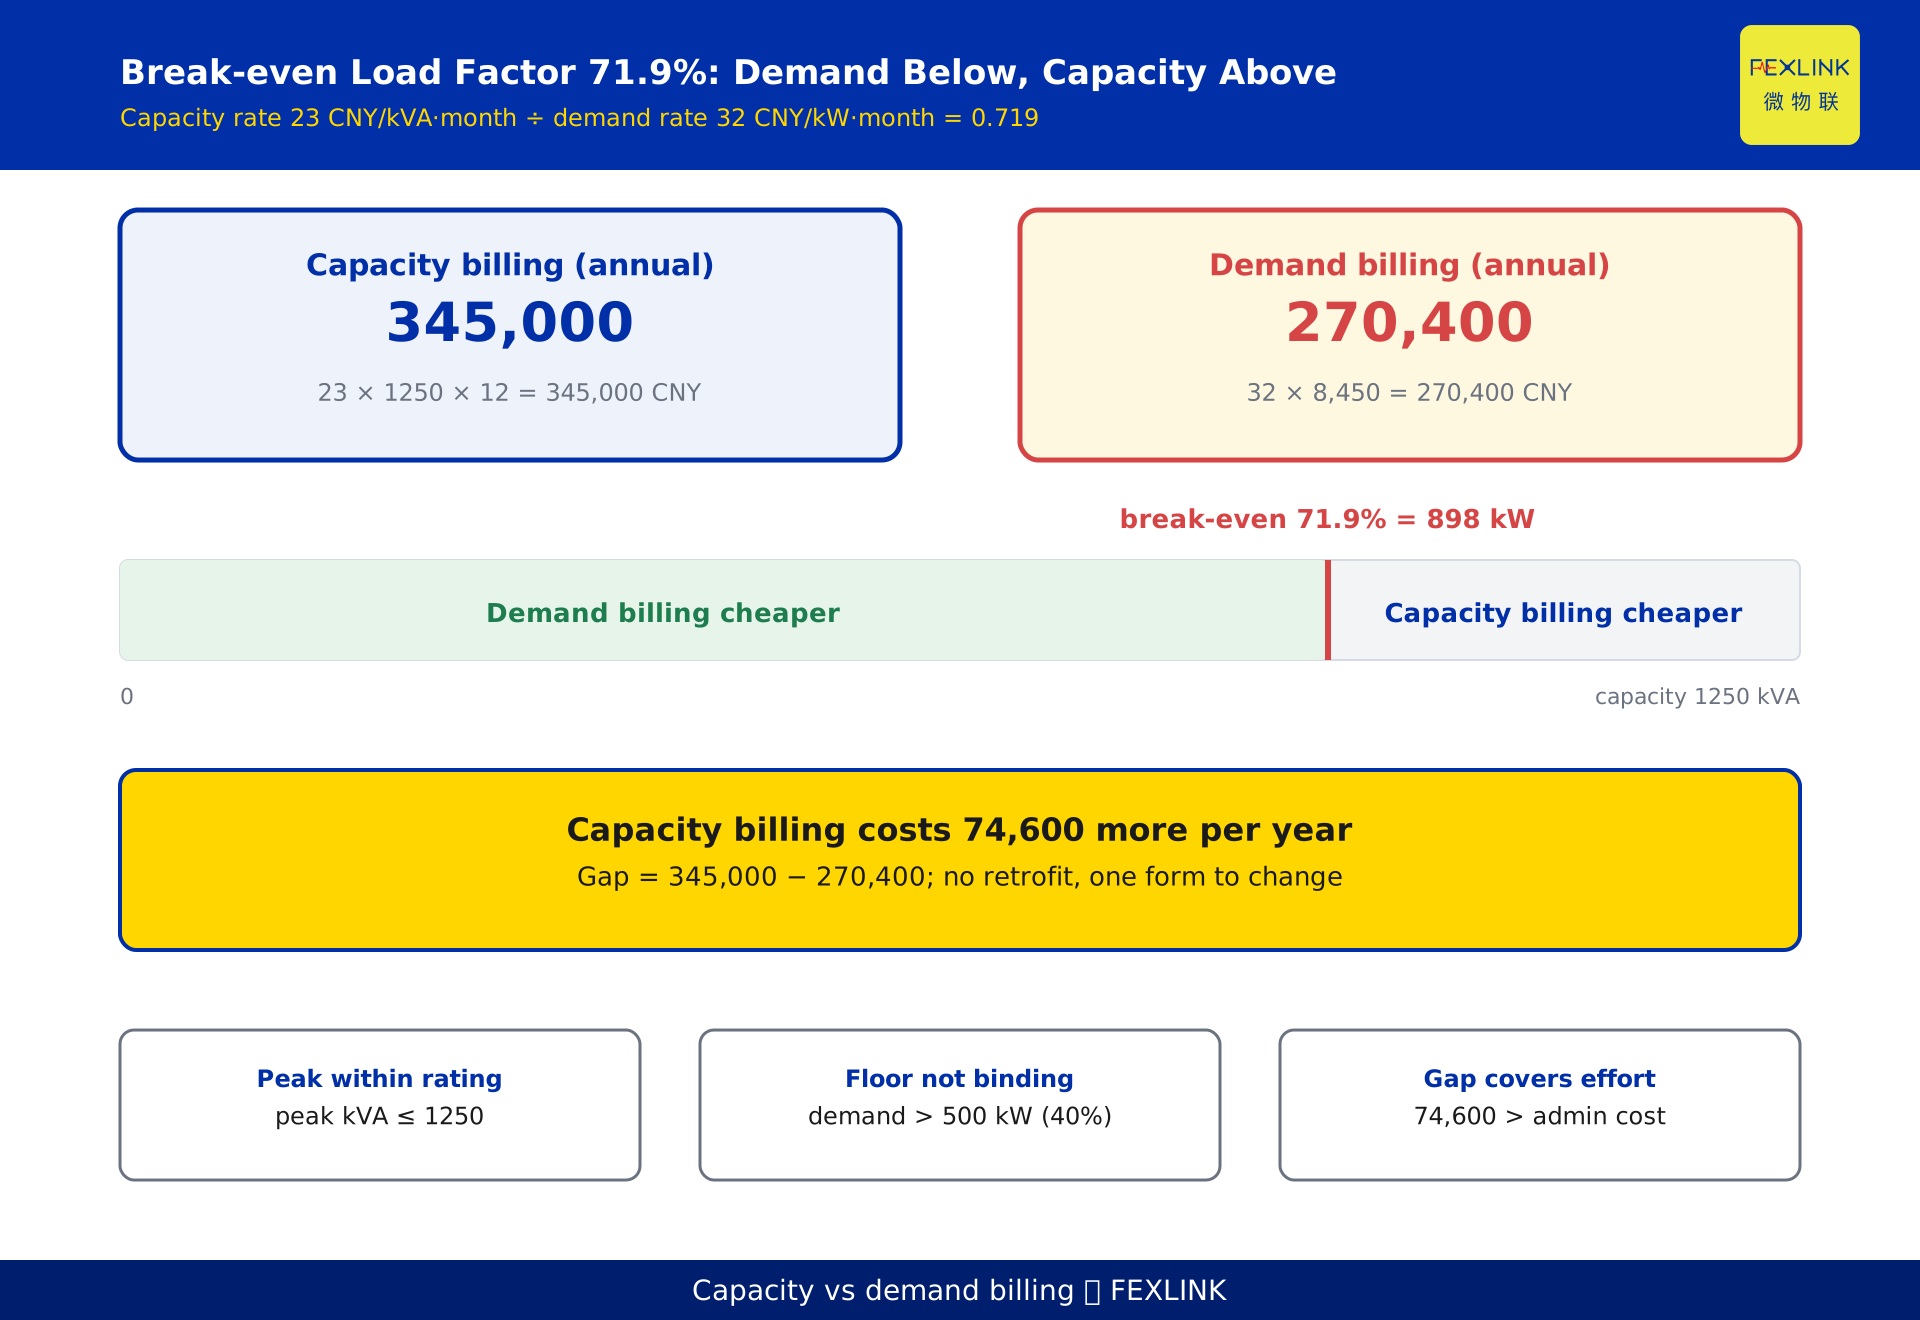
Choosing between capacity and demand billing does not require experience — it requires one equation. Divide the capacity rate by the demand rate and you get the break-even load factor. At 23 CNY/kVA·month for capacity and 32 CNY/kW·month for demand, that factor is 0.719. If your billed demand stays below 71.9% of transformer capacity, demand billing costs less. Above it, capacity billing wins. Three tasks remain: compute the ratio correctly, measure demand correctly, and review the choice once a year.
1. Two ways to charge for the same transformer
A two-part tariff splits the bill in two. The energy charge is levied per kilowatt-hour; the capacity charge is levied on capability — how much of the grid's supply capacity you occupy. How that capability is measured is the user's choice: transformer capacity, or the month's maximum demand.
Capacity billing charges a fixed rate per kVA per month whether the transformer is used or not. Demand billing charges per kW of the highest demand recorded in the month.
The difference is not price level but where the risk sits. Under capacity billing you pay for availability and can never be penalised for a spike. Under demand billing you pay for the sharpest edge you actually reached, and one spike sets the whole month.
2. What billing demand is: the most expensive 15 minutes of the month
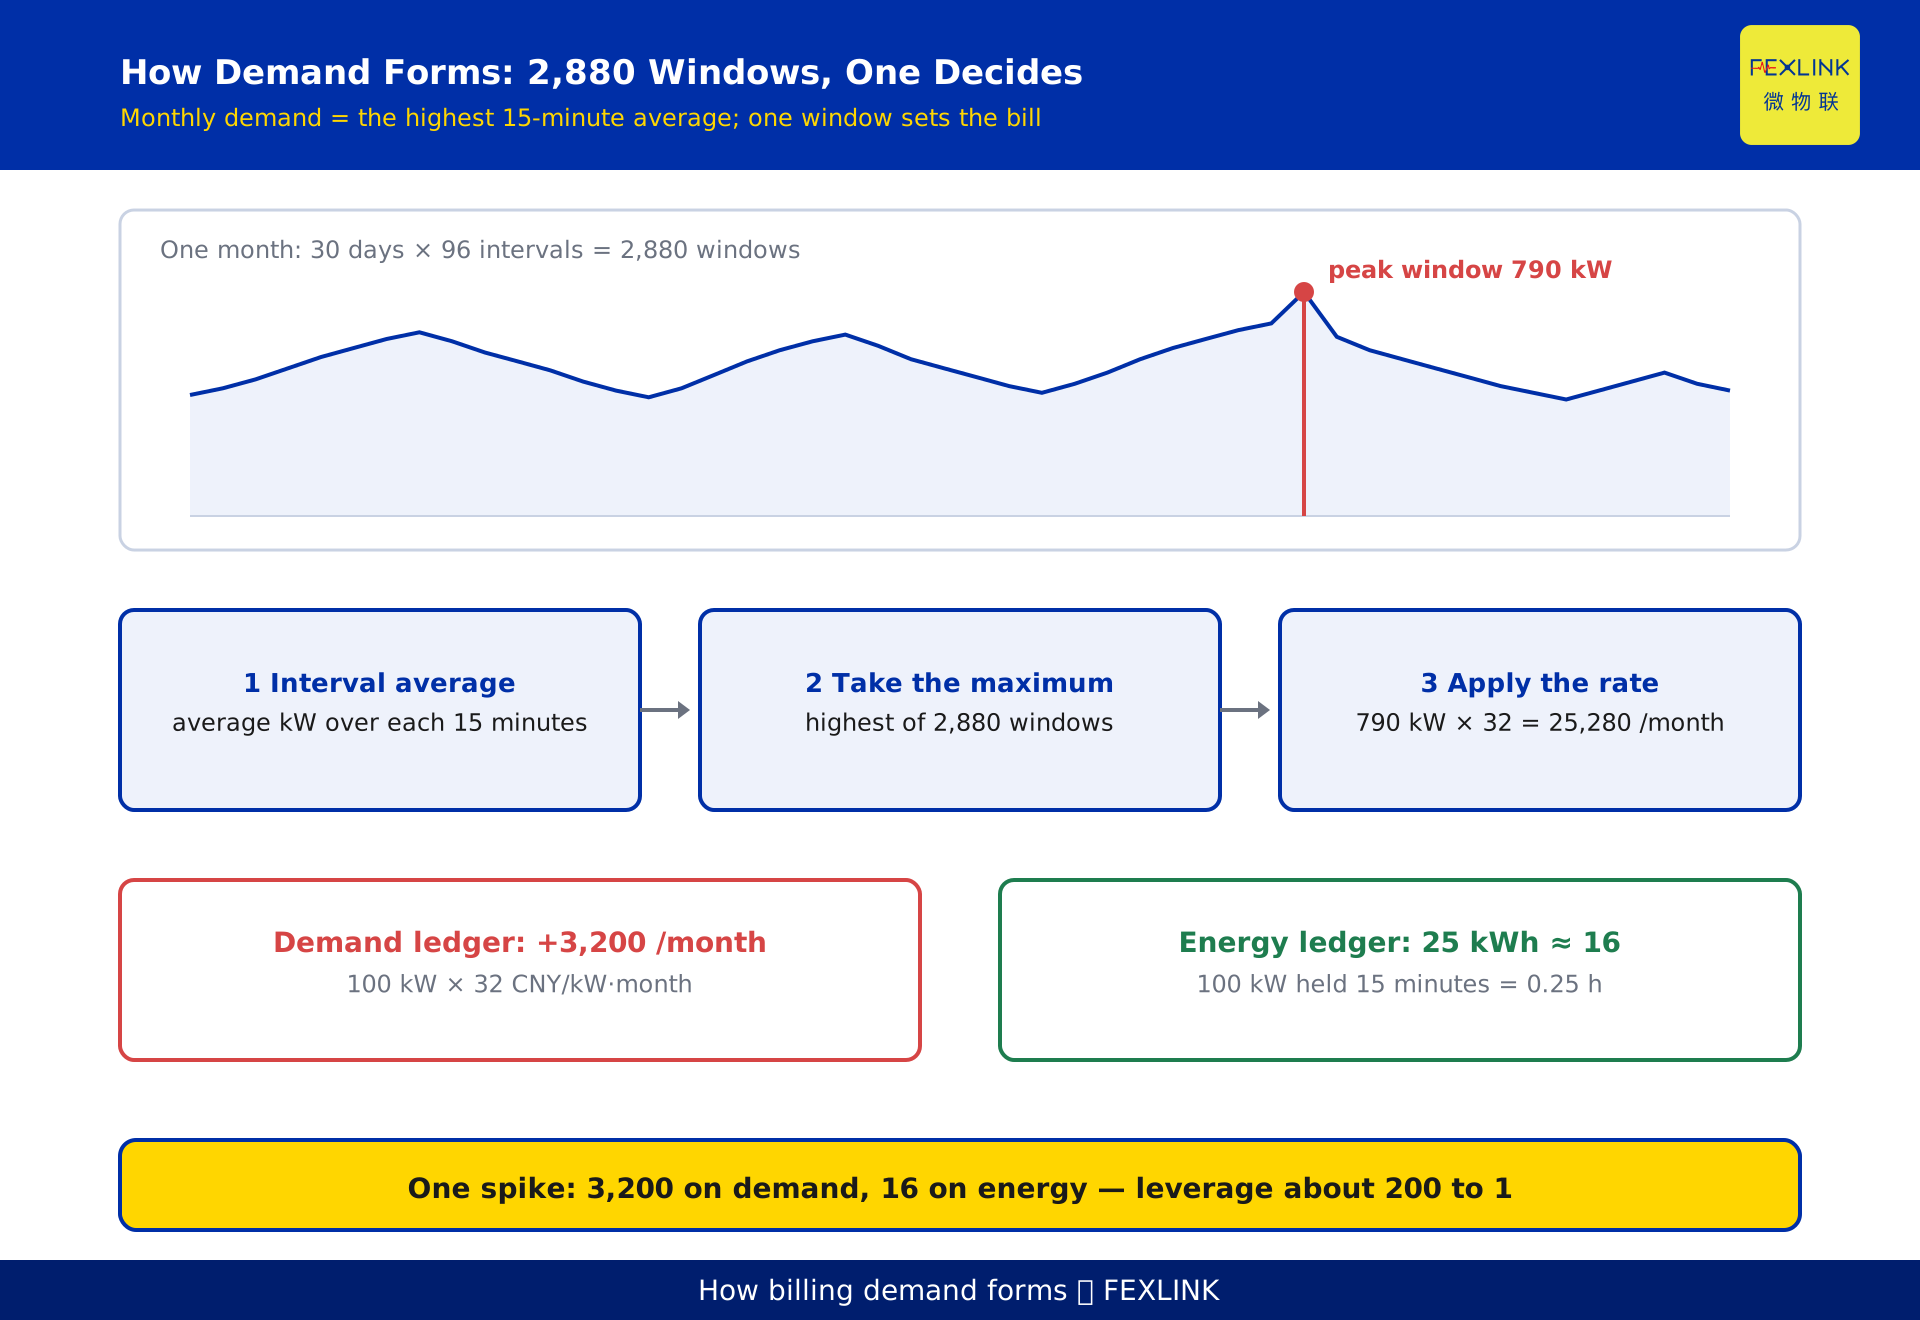
Demand is not average load. It is the maximum average power within a metering interval. Per DL/T 614, the multi-function electricity meter standard, that interval is normally 15 minutes; some regions use 5 minutes or 1 minute. The meter averages active power over each interval and takes the month's highest value, in kW — the billed demand.
Two words matter.
Average means an instantaneous surge does not count, but a surge sustained beyond one interval is captured in full: hold a 200 kW injection moulding machine for 15 minutes and demand rises above 200 kW.
Maximum means the extreme is amplified across time. Thirty days at 96 intervals gives 2,880 intervals a month. One interval at the top sets the bill for all of them; restraint across 2,879 does not offset a single loss of control in the 2,880th.
Demand billing charges for the worst 15 minutes, not for average intensity.
3. Deriving the break-even load factor
Define the symbols. S is transformer capacity in kVA. a is the capacity rate in CNY/kVA·month. b is the demand rate in CNY/kW·month. D is billed demand in kW.
Capacity billing: F_cap = a × S. Demand billing: F_dem = b × D.
Set them equal: a × S = b × D, so D = (a ÷ b) × S.
Divide D by S to get the dimensionless ratio k = D ÷ S. The break-even value is k* = a ÷ b.
That is the whole rule: k* = a ÷ b. Below it, demand billing is cheaper; above it, capacity billing is. No output term, no shift pattern, no equipment efficiency — just two rates and one capacity figure. That is why this can be calculated rather than guessed.
First, k is measured in kW/kVA, not as a percentage "load factor". It already contains the power factor: at 0.90 the ceiling of k is 0.90. So k* = 0.719 is not "only 72%, quite low" — converted to rated active output it equals 0.719 ÷ 0.90 ≈ 80%.
Second, a ÷ b is set by the local published tariff. The only variable you control is D — the leverage sits on the load side.
4. A worked example: 1,250 kVA, 74,600 a year
The following is illustrative. Rates and load data are constructed to demonstrate the arithmetic; they represent no province's published tariff and no real customer.
A factory runs one 1,250 kVA transformer at 23 CNY/kVA·month and 32 CNY/kW·month.
Break-even demand: D* = (23 ÷ 32) × 1250 = 898 kW. Below 898 kW of billed demand, demand billing is cheaper.
Billed demand over the last 12 months ran 620, 660, 700, 730, 760, 790, 780, 750, 720, 680, 640, 620 kW — 8,450 kW·months in total, peaking at 790 kW.
Capacity billing: 23 × 1250 × 12 = 345,000. Demand billing: 32 × 8,450 = 270,400. The gap is 74,600 a year — no retrofit, no equipment, just a change of billing basis.
Check the direction: the 790 kW peak gives k = 790 ÷ 1250 = 0.632, below the 0.719 break-even. At a power factor of 0.90 that is roughly 878 kVA, a 70.2% loading — the transformer is oversized, and the tariff has been charging for it.
Reverse it: if the peak were 950 kW, k = 0.76, above break-even, and capacity billing would be cheaper — 950 × 32 × 12 = 364,800, or 19,800 more under demand billing. Same transformer, same tariff, opposite conclusion.
5. Why peak shaving beats kilowatt-hour saving
Under demand billing, a kilowatt of peak and a kilowatt-hour differ by two orders of magnitude.
At 32 CNY/kW·month, shaving 100 kW off the peak saves 100 × 32 × 12 = 38,400 a year, or 3,200 a month. That same 100 kW, sustained for a single 15-minute interval, is 100 × 0.25 = 25 kWh, worth 16 at 0.65 CNY/kWh.
One 15-minute spike: 3,200 on the demand ledger, 16 on the energy ledger — leverage near 200 to 1.
Energy still matters, but under demand billing finding the peak pays better than finding kilowatt-hours, and costs far less: no equipment purchase, just stagger two large loads by 15 minutes. That is the highest-return action here, and the one most plants never take — the bill shows a single maximum-demand figure and never says which day, which circuit, which quarter hour produced it.
6. Three constraints on declared demand
Demand billing is not simply "pay for what you use".
The declared floor. Most regions require declared demand to be no lower than a set fraction of capacity, commonly 40%. For a 1,250 kVA transformer the floor may be 500 kW: even at 300 kW of actual demand, the charge is computed on 500 kW. Once the floor binds, the advantage of demand billing compresses sharply.
The excess multiplier. Where billing is on declared demand, excess over the declaration is commonly charged at double, often 2×. Declaring low does not mean billed on actual; it means billed at twice actual.
The change cycle. Switching the billing basis requires an application to the utility, is limited in frequency in most regions, and takes effect the following month. You carry at least one month of estimation error.
Together these draw the boundary: demand billing suits steady loads with predictable peaks. The test is simple. Rank the last 12 months of demand and see how far the second-highest sits below the highest. Close together means peaks are routine and demand billing is safe. A clear outlier means peaks are episodic, and demand billing takes that risk in full — which is exactly where capacity billing earns its money.
7. Review cadence and switching triggers
The billing basis is not a lifetime decision; the annual review is.
Monthly: record only. Log billed demand, capacity and k on one sheet. One month cannot establish a direction; 12 can.
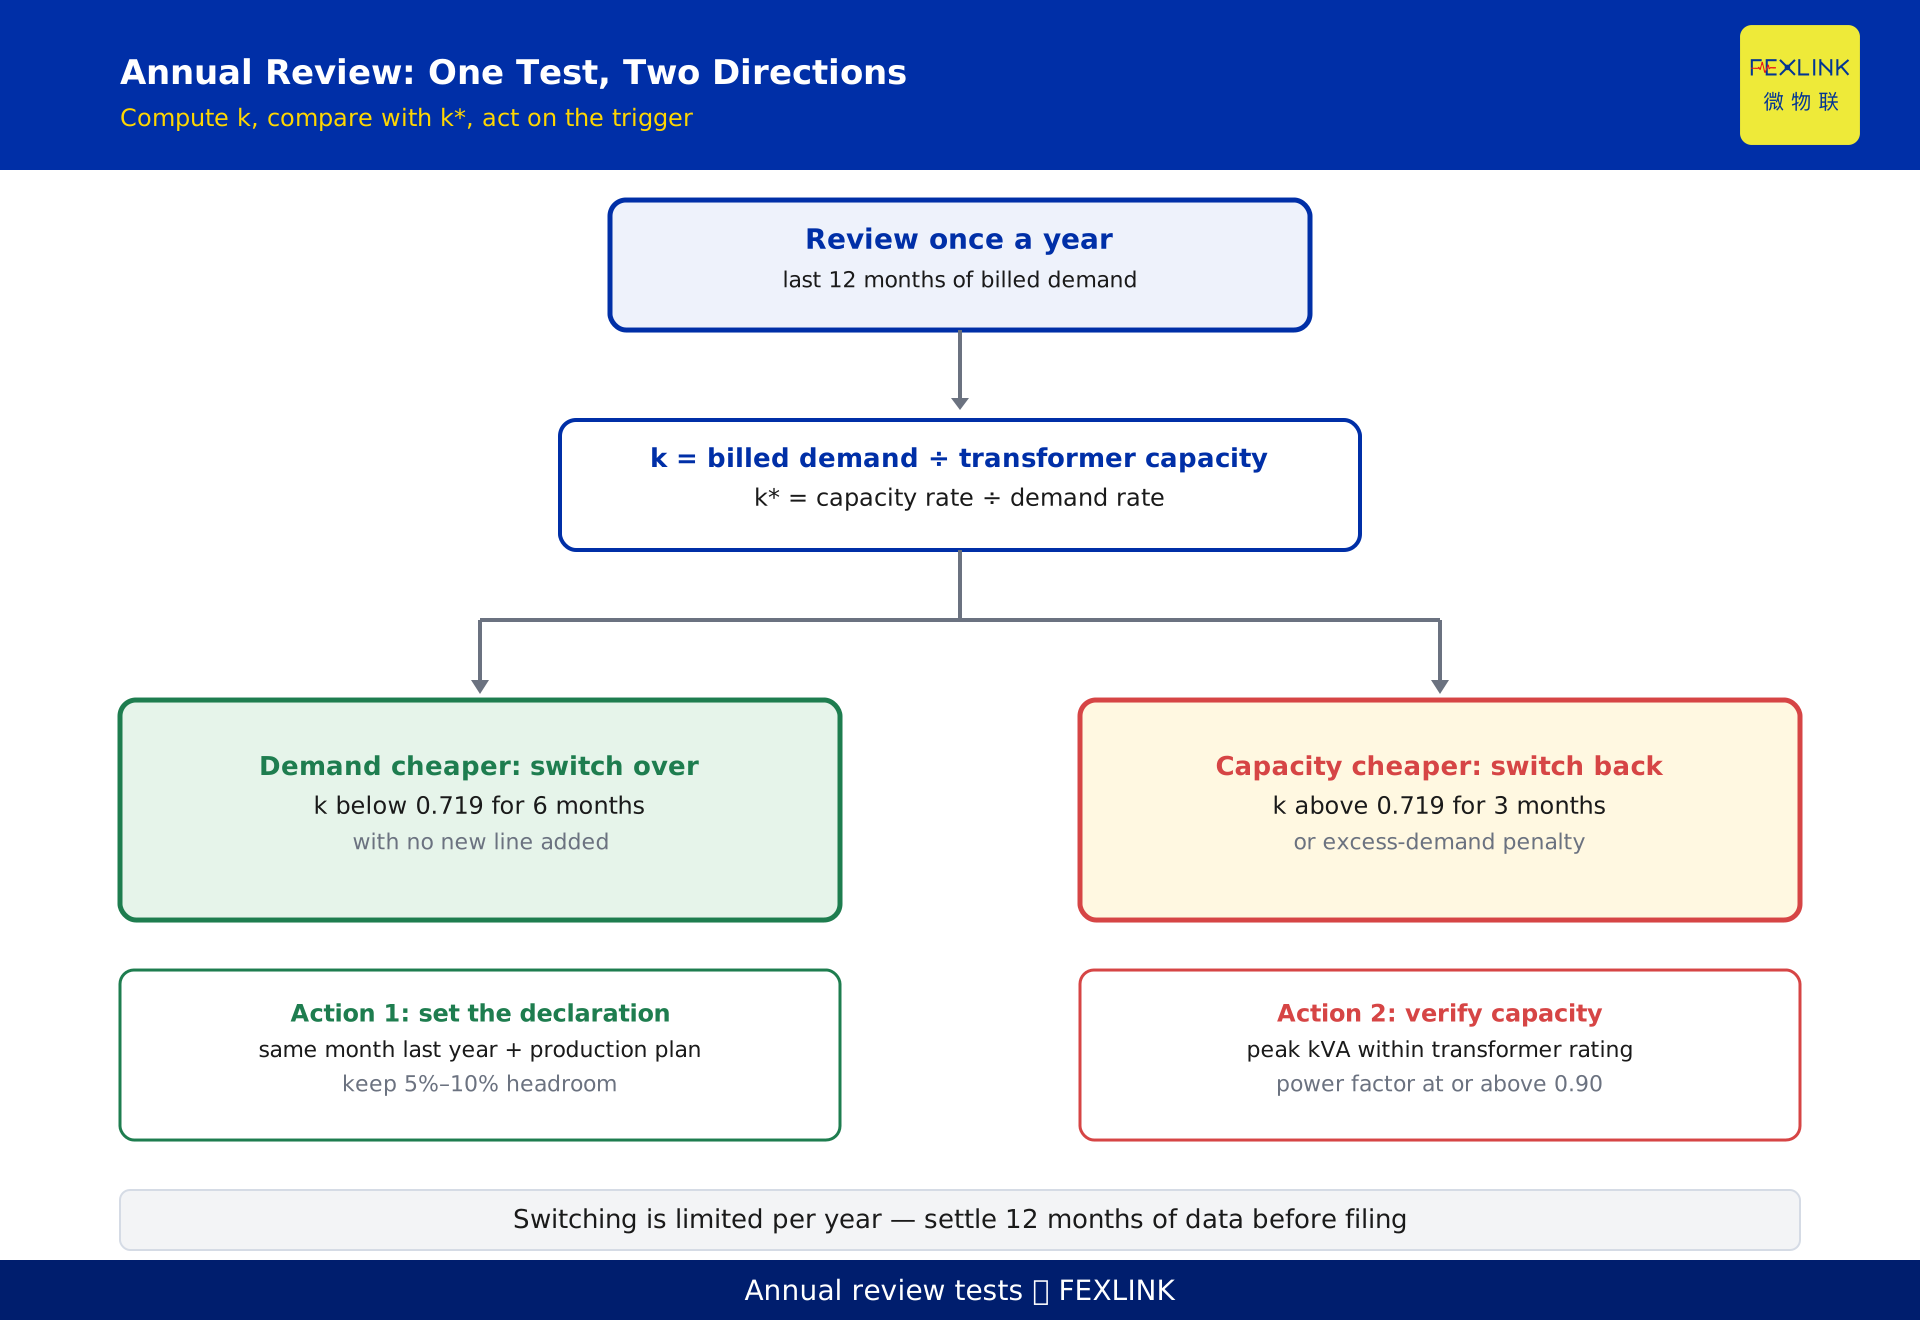
Quarterly: watch for triggers. First, six consecutive months with k below 85% of break-even — 0.719 × 0.85 ≈ 0.611 here — with no new line added. Second, three consecutive months of excess-demand penalty, or a single-month jump above 20% that cannot be attributed. The second is the reverse signal: switch back to capacity.
Annually: formal review. Time it after the peak season, once the summer peak has passed, and recompute k* on a full 12 months. Check three things: whether capacity changed, whether the billing basis was altered by default, and whether power factor has fallen below 0.90.
Event-driven: immediate review. Capacity change, a line starting or stopping, a shift-pattern change, or a new single load above 10% of capacity. Each changes the peak directly; waiting for the annual review is too late.
One further test. If k sits below 0.4 for long, the problem may not be the billing basis but an oversized transformer. Capacity reduction cuts the billing base, the no-load loss and the declared-demand floor at once. Changing the basis changes how you pay; reducing capacity changes what you pay on.
8. Three checks before you switch
The arithmetic is only step one. Three things must be verified before applying; miss one and the saving evaporates.
Does the nameplate match the asset register? A wrong capacity figure corrupts a full year of billing. Old plants commonly have a replaced transformer with an unchanged register, or two transformers in parallel declared as one.
Is the demand taken from the gateway meter? Demand must be read at the billing metering point; sub-meter demand cannot be declared. Estimating plant demand from a workshop sub-meter looks right but is unusable — sub-meters exclude line losses and unmetered auxiliary load, so the estimate runs low.
Is power factor above the assessment threshold? Switching usually comes with reactive compensation adjustments. A drop from 0.93 to 0.88 lets the power-factor adjustment absorb part of the gain — potentially half of the 74,600.
9. How demand gets measured and replayed
Every calculation assumes the demand figure is right.
Demand is an extreme value, and extremes tolerate metering error far less than averages do. Over 8,760 hours an energy error averages out; a demand error lands undiluted on the single highest interval. If sampling is coarser than the demand interval, the peak is flattened: five minutes of data inside a 15-minute window yields a structurally low average. You believe the peak was shaved; it was never measured.
This is what circuit-level metering is for. The ESA all-element smart meter (for example ESA-22131-R, 3×400A, 3×220/380V, RS485 Modbus) is installed per circuit with sampling aligned to the demand interval, so every 15-minute average is stored and can be replayed by day and month. Which circuit, day and quarter hour produced the highest window becomes a query rather than a guess. One selection detail: the ESA series has no phase or harmonic monitoring — the ESB three-phase imbalance monitor covers phase, the ESE power quality monitor covers harmonics.
Above that, the peak-and-demand optimisation programme splits historical demand by circuit, locates the peak source, and issues an action list of staggering or power-limiting steps. Declaring demand also needs a short-horizon forecast; the Tianyan engine's E-06 model covers a 15-minute to 2-hour window.
10. FAQ
Q: Which is more expensive, the capacity rate or the demand rate?
On unit price alone, the demand rate usually runs 1.3 to 1.5 times the capacity rate. But the units differ, so comparing unit prices is meaningless. Compare annual totals using the equation above with your own figures.
Q: Our transformer runs near full load. Is capacity billing automatically cheaper?
Largely yes. Once k approaches a ÷ b, capacity billing wins. But confirm whether "full load" means kVA or kW — at a power factor of 0.85, full apparent load may only reach k = 0.85.
Q: Can we declare demand low and just pay actual if we exceed it?
No. Most regions charge the excess at double, commonly 2×. Declaring low does not save money; it multiplies risk. Set the declaration from the same month last year plus a production-plan adjustment, with 5% to 10% headroom.
Q: Does switching require a shutdown or equipment changes?
Neither. It is a change in settlement basis, handled through the utility — no outage, no hardware. What changes is the load-management actions that determine whether k falls, and the metering data you rely on.
Q: We run two transformers, one duty and one standby. How is that billed?
Total capacity follows the declared installation; total demand follows the gateway meter. Whether standby attracts the capacity charge varies widely — some regions exempt approved cold standby, while hot standby is normally charged. The local utility's interpretation governs, and this is the most common source of overpayment at two-transformer sites.
Scope and limitations
- This applies to large industrial users on two-part tariffs. Single-part tariff users have no capacity charge, and the equation here does not apply.
- The capacity rate of 23 CNY/kVA·month, the demand rate of 32 CNY/kW·month, the 12-month demand series, the 345,000 and 270,400 totals and the 74,600 gap are illustrative parameters. They represent no province's published tariff and no real customer. Actual calculation requires the local published tariff and gateway-meter data.
- Demand intervals are described as 15 minutes, following DL/T 614. Some regions use 5-minute or 1-minute intervals; the local metering convention governs.
- The declared-demand floor (illustrated at 40%), the excess multiplier (illustrated at 2×) and annual limits on switching are region-specific; do not apply them directly. The 0.90 power factor threshold follows current power factor adjustment rules; bands and penalty ratios differ by region.
- Model numbers and specifications for the ESA all-element smart meter, the ESB three-phase imbalance monitor, the ESE power quality monitor and the Tianyan engine's E-06 model are subject to the latest selection manual and product knowledge base. This is not a procurement recommendation.
Frequently Asked Questions
Capacity vs. Billing Demand Charges
Choosing between capacity and demand billing does not require experience — it requires one equation