 FEXLINK Research Institute
Direct Answer
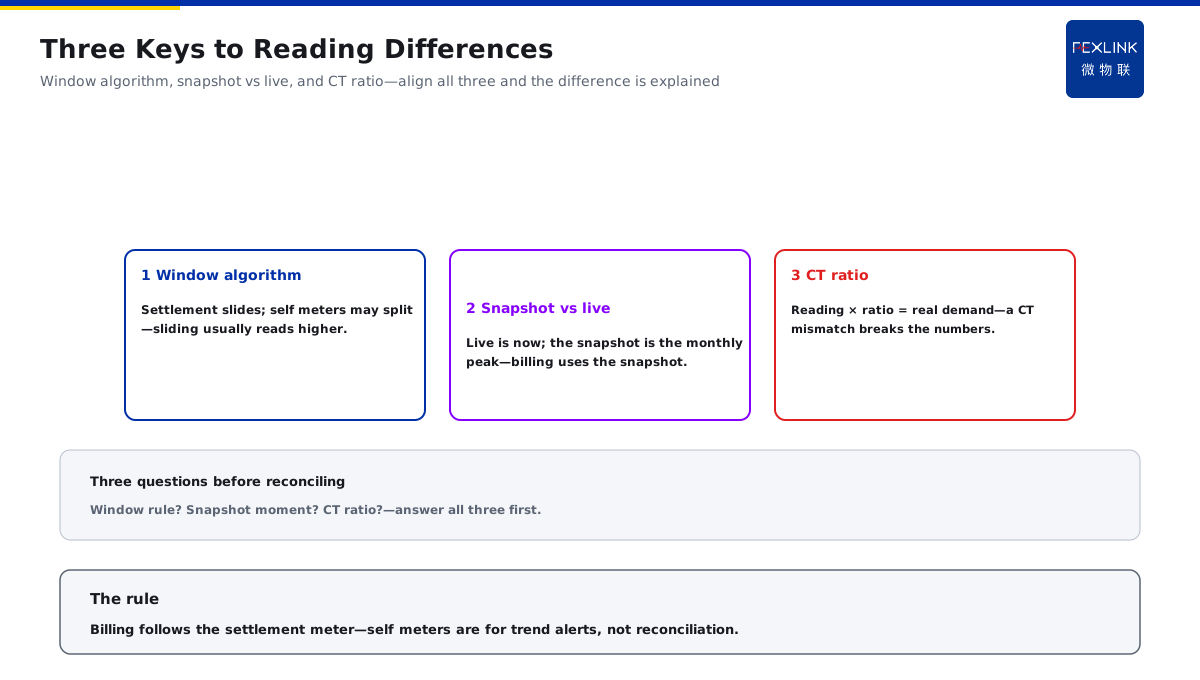
Slightly exceeding the demand costs thousands extra? The reading differences come from three points — the billing meter (the settlement meter) uses sliding-window demand while the self-installed monitoring meter may use a different window, the meter-read moment takes the month's maximum, and the instrument-transformer ratio — billing follows the settlement meter, and the self-installed meter is for trend warning, not for reconciliation.
A scenario: A company's self-installed monitoring meter shows that the month's maximum demand does not exceed the limit — but the bill charges a higher demand — the company appeals to the supply company, which speaks with the settlement-meter data — the appeal goes nowhere. The logic is that the self-installed meter and the settlement meter are not the same "ruler" — different window algorithms, different reading moments, and possibly different ratios — understand the reading differences first, then talk about reconciliation.
1. The Window Difference between Billing Demand and Self-Monitored Demand
The settlement meter (billing demand) — installed by the supply company and metered per the contract rules: commonly sliding-window 15-minute continuous calculation; The self-installed meter (monitored demand) — bought by the company with settable parameters: the window algorithm may differ from the settlement meter; The window difference — interval type vs sliding type: the interval type divides by fixed periods and the sliding type slides continuously; The effect on the result — different windows give different readings: the sliding type is usually not lower, and the interval type may be lower.
In one sentence: the settlement meter and the self-installed meter use different window algorithms, so the measured demand may differ — the settlement meter is the standard.
The three questions before reconciliation — is the window algorithm asked: does the settlement meter use sliding or interval; is the reading moment asked: is the settled value the month's maximum or the current value; is the ratio configuration asked: are the instrument-transformer ratios consistent — with the three questions answered, the reading differences can be explained.
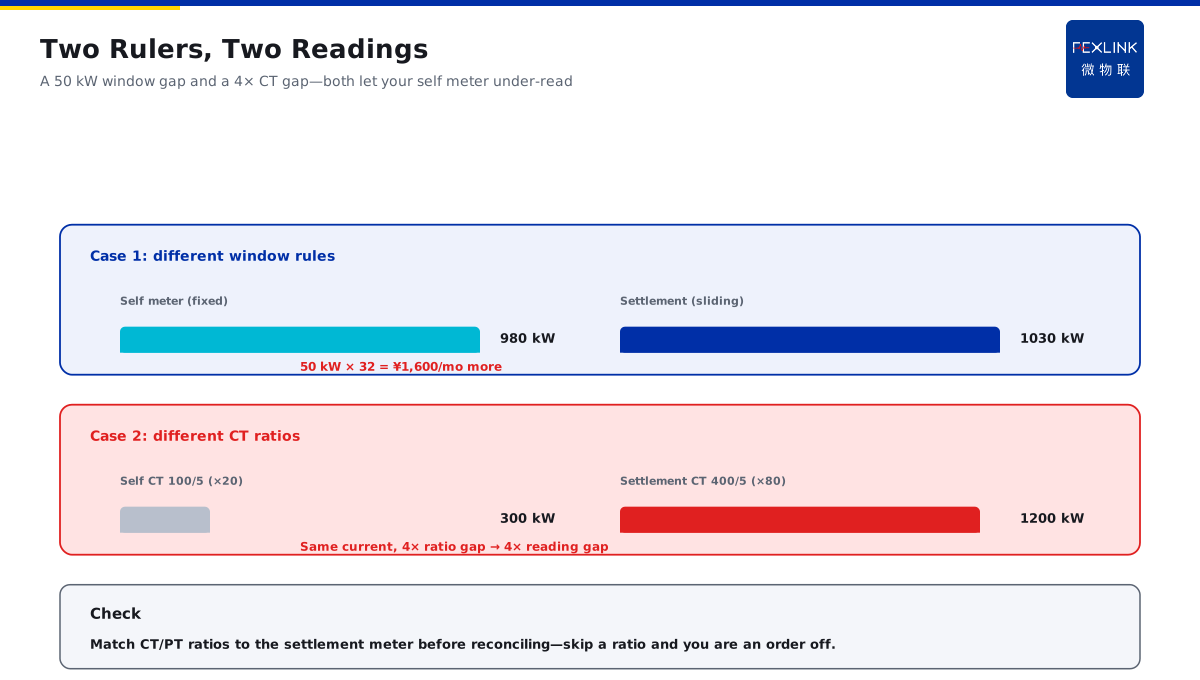
An example: A company's self-installed meter uses the interval type and shows a monthly maximum demand of 980 kW; the settlement meter uses the sliding type and bills 1030 kW — a difference of 50 kW, at a demand price of 32 yuan, means 1,600 yuan more. The logic is that the 50 kW difference comes from the window algorithm — the meter is not broken, the basis is different — align the window rule before reconciling.
2. Why the Sliding-Window Demand "Hits" the Peak More Easily than the Interval Type
The sensitivity of sliding — continuous sliding captures the complete peak: a peak crossing the boundary is not cut up; The miss of the interval type — the fixed boundary may cut up a peak: the peak spreads into two windows, each counting half; The preference of the settlement meter — the sliding type is more common: settlement meters generally adopt the sliding rule; The consequence of "hitting" — the sliding reading is higher: a self-installed meter using the interval type "under-reads" its own demand.
In one sentence: the sliding type slides continuously and fully captures the peak, so its reading is usually not lower than the interval type — a self-installed meter using the interval type "under-reads" the demand.
A direct way to understand sliding — draw your own 15-minute window demand bars: consistent with the settlement-meter basis; find the peak window: see whether it crosses a fixed-hour boundary; compare the two sets of readings: how much and where they differ — three steps, and the sliding difference is clear.
An example: A company has a peak wave from 0:10 to 0:20 — the interval type cuts it into two windows and spreads it in half; the sliding type has one window fully containing it — the sliding reading is 8% higher. The logic is that the same peak wave gives two results with two algorithms — the company monitoring with the interval type naturally feels it "has not exceeded" — the settlement meter with the sliding type "hits" the peak — the asymmetric basis is the first source of the reading difference.
3. The Difference between the Meter-Read Maximum and the Real-Time Value
The real-time value — the demand at the current moment: changes at any time and is not the settlement basis; The meter-read value — the accumulated maximum read at the meter-read moment: the month's maximum demand recorded by the settlement meter; The meter-read moment — usually at the month end or the start of the next month: the whole month's accumulated maximum is read; The misreading risk — taking the real-time value as the conclusion: seeing a low current value and thinking the whole month has not exceeded.
In one sentence: the real-time value is "now" and the meter-read value is the "month maximum" — settlement follows the meter-read value, and the real-time value is only a reference.
The comparison table of the real-time value and the meter-read value:
| Item | Real-time value | Meter-read value |
|---|---|---|
| Period reflected | Now | Month maximum |
| Can it settle | No | Yes |
| Change feature | Changes at any time | Frozen at month end |
| Use scenario | Reference | Reconciliation |
An example: A company sees a real-time demand of 900 kW on the 20th and feels safe — the settlement meter records a maximum demand of 1050 kW at the month end — a peak several days earlier has already passed from the real-time view. The logic is that the real-time value reflects only the present and the meter-read value reflects the whole month — the trace of a peak that appeared cannot be seen in the real-time value — watch the trend record, not the real-time value.
4. The Amplification of Ratio Errors on the Demand Reading
The source of the ratio — the instrument-transformer ratio: the voltage transformer and the current transformer; The application of the ratio — the demand reading times the ratio equals the actual demand: missing the ratio makes the reading differ by an order of magnitude; The ratio configuration — the settlement meter and the self-installed meter may differ: inconsistent meter parameters give inconsistent readings; The ratio check — check before reconciling: whether the CT/PT ratios are consistent with the settlement meter.
In one sentence: the demand reading times the instrument-transformer ratio is the actual value — with inconsistent ratios, the readings cannot match directly.
The points of the ratio check — check the CT ratio: whether the primary/secondary current matches the meter parameters; check the PT ratio: whether the voltage-transformer ratio is consistent; check the combined ratio: whether the CT ratio times the PT ratio matches the settlement meter — with the three checks, the ratio error is excluded.
An example: A company's self-installed meter is configured with a CT ratio of 100/5 (20 times), while the settlement meter is 400/5 (80 times) — for the same current, the self-installed reading is only a quarter of the settlement reading — the self-installed meter shows 300 kW and the settlement meter bills 1200 kW. The logic is that a 4-times ratio gives a 4-times reading difference — not a meter problem but a configuration problem — check the ratio consistent before reconciling.
5. Which Indicator the Enterprise Should Watch for Warning
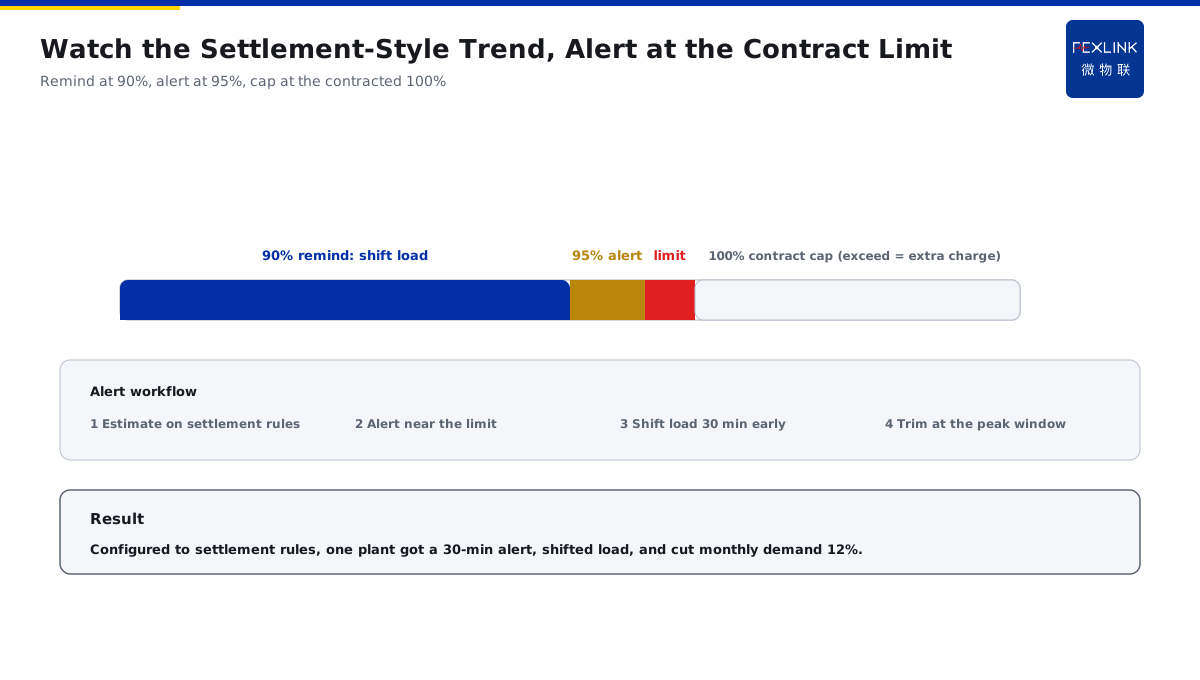
The warning indicator — the demand trend in the settlement-meter basis: estimate one's own demand by the settlement-meter window rule; The warning threshold — the contracted billing demand: trigger the warning when approaching, and stagger in advance; The warning data source — the self-installed trend plus the settlement check: the self-installed meter watches the trend and the settlement meter checks the result; The warning action — stagger when approaching the threshold: predict the peak window and press the load in advance.
In one sentence: watch the demand trend in the settlement-meter basis and set the contract-threshold warning — the self-installed meter does the trend and the settlement meter does the reconciliation.
The reference for warning-threshold setting — the contracted demand is the baseline: near 90% triggers a reminder and 95% an alarm; leave a safe margin: actual production fluctuates, so do not warn right at the limit; calculate the over-limit consequence first: how much exceeds and how much extra, known in advance — the three layers make the warning not idle.
An example: A company configures the ESA smart meter windows by the settlement-meter rule — the platform estimates the demand by sliding and warns when approaching the contracted demand — one day the peak window warns 30 minutes in advance and the staggering succeeds — the month's demand is 12% lower than last year. The logic is that the premise of the warning is a consistent basis — estimating one's own demand by the settlement-meter rule makes the warning accurate — with the wrong basis, the warning is "self-deception".
Back to the ESA all-element smart meter and the SFA multi-element monitoring controller match — the ESA meter supports sliding-window demand metering: configured by the DL/T 448 settlement rule — the SFA controller collects the end-load data: assisting the peak-window prediction — the energy supervision center draws the demand trend curve in the settlement-meter basis — automatically warns when approaching the contracted demand — the enterprise staggers in advance, the demand does not exceed and the charge does not rise — the reading differences move from "cannot match" to "understandable".
The demand reading differences come from three points: different window algorithms, the meter-read value vs the real-time value, and the instrument-transformer ratio — the settlement meter uses sliding and the self-installed meter interval, so the readings differ — the real-time value is not the month maximum, and inconsistent ratios cannot match — billing follows the settlement meter and the self-installed meter does the trend warning — configure the monitoring by the settlement-meter basis and set the contract-threshold warning — the ESA meter meters by the DL/T 448 settlement rule and the platform warns by the demand trend — with the reading differences understood, the demand charge is manageable.
Scope and Limitations
- The conclusions in this article are intended for LV distribution and electrical-safety sites. Standard numbers (DL/T 448) refer to their currently effective editions, and product parameters follow the latest FEXLINK selection handbook and product knowledge base.
- Quantitative criteria (protection zone, discharge and residual voltage, earth resistance, thresholds and grading) hold under the preconditions stated in this article. Where the site voltage level, earthing arrangement, environmental category or load profile differs, the figures must be recalculated. Specific configurations involving ESA all-element smart meter, SFA multi-element controller should be verified against actual circuit parameters.
- Specific product models and parameters are subject to the latest selection handbook and product knowledge base; this article does not constitute selection or procurement advice.
- Standard numbers cited here refer to the currently effective editions; when a standard is revised, the related quantitative conclusions must be re-checked.
- Deployment and implementation for specific projects must be carried out by qualified engineers based on site survey and design drawings.
Frequently Asked Questions
Slightly Exceeding Demand Costs Thousands Extra
The reading differences come from three points — the billing meter (the settlement meter) uses sliding-window demand while the self-installed monitoring