 FEXLINK Research Institute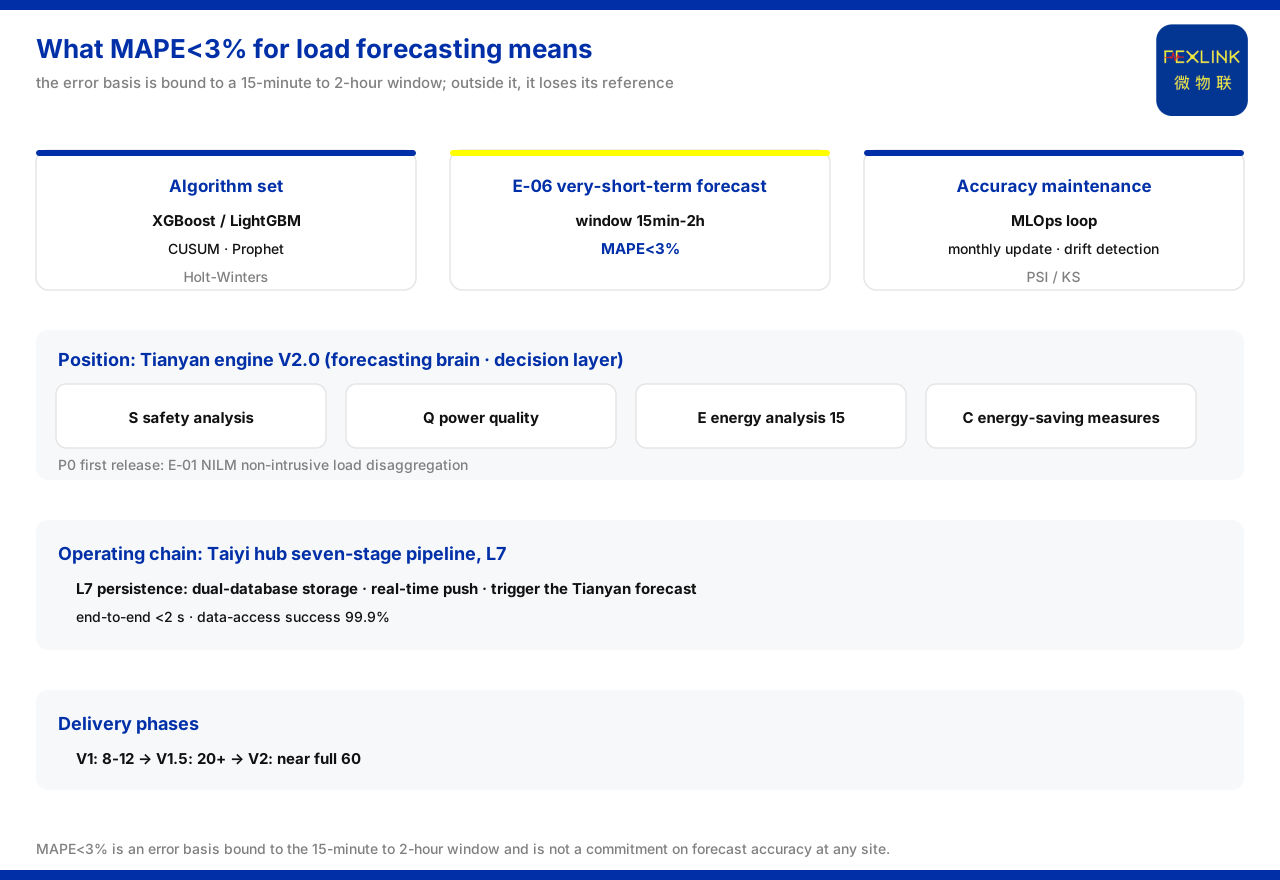
What MAPE<3% for load forecasting means
Direct answer
A mean absolute percentage error (MAPE) below 3% is the error basis given by the E-06 very-short-term load forecast of the Tianyan engine (forecasting, V1.0→V2.0). It measures the average percentage deviation of the predicted value from the actual value, and it is bound to a forecast window of 15 minutes to 2 hours: apart from this window and its algorithmic premises, citing MAPE<3% on its own loses its reference. E-06 uses XGBoost and LightGBM and is one of the models in the E energy-analysis block under the Tianyan engine V2.0 plan. MAPE<3% should therefore be understood as a performance statement for a specific task under a specific window, not as a general guarantee of forecast performance at any particular site.
Two consequences follow. First, the figure is only comparable when the task and the window are stated alongside it: a MAPE value for a 15-minute-ahead forecast and one for a 2-hour-ahead forecast describe different problems, and neither can be quoted as the other. Second, the percentage form means the basis is a relative deviation averaged over the window; it does not by itself state the absolute error, the distribution of errors across the window, or the behaviour under abnormal conditions. The metric therefore functions as a task-scoped accuracy statement, and reading it correctly means reading its scope at the same time.
Metric bound to the window
The interval of 15 minutes to 2 hours defines the boundary of "very-short-term": its lower end is at the minute level and its upper end at the hour level. MAPE below 3% is bound to this window, and what it measures is the average percentage deviation within that time range. Only by remembering the window together with the error basis can one avoid, in practical citation, confusing "very-short-term" with "short-term" and "medium-term", and avoid misreading the error basis as a general guarantee. XGBoost and LightGBM, on which E-06 relies, are values drawn from the core algorithm set of the Tianyan engine; that set also includes CUSUM change-point detection, Prophet (injecting Arrhenius electrical knowledge) and Holt-Winters triple exponential smoothing, and different tasks select different tools. The window is the unit of validity because within 15 minutes to 2 hours the load is dominated by the near-term continuation of current operating behaviour, and the model is specified for exactly that regime. Outside it, the same output is no longer backed by the same algorithmic premises, so extending MAPE<3% to short-term or medium-term horizons would attach the figure to a task for which it was not given.
Position of the model in the system
In the family overview, the Tianyan engine is positioned as the "forecasting brain · decision layer", with the responsibility of 67 forecasting models. Its V2.0 is divided into four blocks, S safety analysis, Q power quality, E energy analysis, and C energy-saving measures. Within the E energy-analysis block, the planned model count under V2.0 is 15 items, while the documentation introduction basis is 9; the two coexist, and the source of the basis should be noted when citing. E-06 sits inside this block, and the P0 first-release model of the same block is E-01 NILM non-intrusive load disaggregation. Only by placing E-06 back into the system can one understand that MAPE<3% is the metric of one specific model among the 67 models. Block assignment and release order are separate pieces of information: the block states which section of the engine the model belongs to, while the P0 designation states its order of release within that block. The two should be read side by side rather than inferred from one another, and neither should be confused with the delivery-phase question of which release the model lands in.
How accuracy is maintained: the operations loop
The MLOps loop recorded in the product knowledge base is: expert annotation and automatic annotation, batch training and online incremental training, multi-metric validation, shadow deployment, A/B testing, PSI and KS drift detection, together with monthly model updates. For E-06 this means that the forecasting model is not trained once and then fixed, but is updated monthly and judged by drift detection as to whether the data distribution has shifted. Shadow deployment and A/B testing are used to compare model performance before a formal replacement. This article does not restate the scale of training data, feature-engineering details or the annotation flow; the product knowledge base does not list these. The loop's purpose is to keep a published accuracy figure from silently decaying: drift detection flags when the incoming distribution no longer resembles the training distribution, and shadow deployment plus A/B testing provide a controlled comparison before a new version replaces the live one. This is a process statement about how the metric is maintained, not a statement about the metric's value at any site.
Operating chain
The seven-stage pipeline of the Taiyi intelligent control hub system closes at L7 persistence, whose actions include dual-database storage, real-time push and triggering the Tianyan forecast, with an end-to-end time below 2 seconds and a data-access success rate of 99.9%. This shows that load forecasting runs after L7 of this chain: the data first completes access and processing, and then triggers the forecast. For the accuracy metric to land in operations, it depends precisely on this continuously data-supplying chain rather than on an isolated algorithm; a data-access success rate of 99.9% also shows that the chain provides the forecast with a relatively stable data input. The order matters: because the forecast is triggered after persistence, its input quality is bounded by the upstream access and processing stages, so a stable access rate is part of the accuracy story even though it is not itself an accuracy figure.
Delivery phases
The delivery of the Tianyan engine is divided into three phases: V1 selects 8 to 12 models, V1.5 expands to more than 20, and V2 approaches the full count of 60. In other words, whether E-06 lands in a given phase depends on the model list selected for that phase, and this article does not infer the phase to which it belongs. Phase selection and model identity are different questions; the phase list defines the scope of each delivery, while the model list defines what is inside it.
Scope and limitations
This article answers only "what MAPE<3% means", and its content is limited to the model algorithms, forecast window, error basis, block division, operations loop, operating chain and delivery phases already recorded in the product knowledge base.
"15 items" and "9" are two coexisting bases for the E energy-analysis block; this article presents both and does not substitute one for the other.
MAPE<3% is an error basis bound to the 15-minute-to-2-hour window and does not constitute a commitment regarding the forecast accuracy at any specific site.
This article does not provide model training details, feature lists, annotation scale, hardware configuration or any indicator not listed; actual application must be confirmed item by item in conjunction with data quality, sampling conditions and the latest product documentation.