 FEXLINK Research Institute
Direct Answer
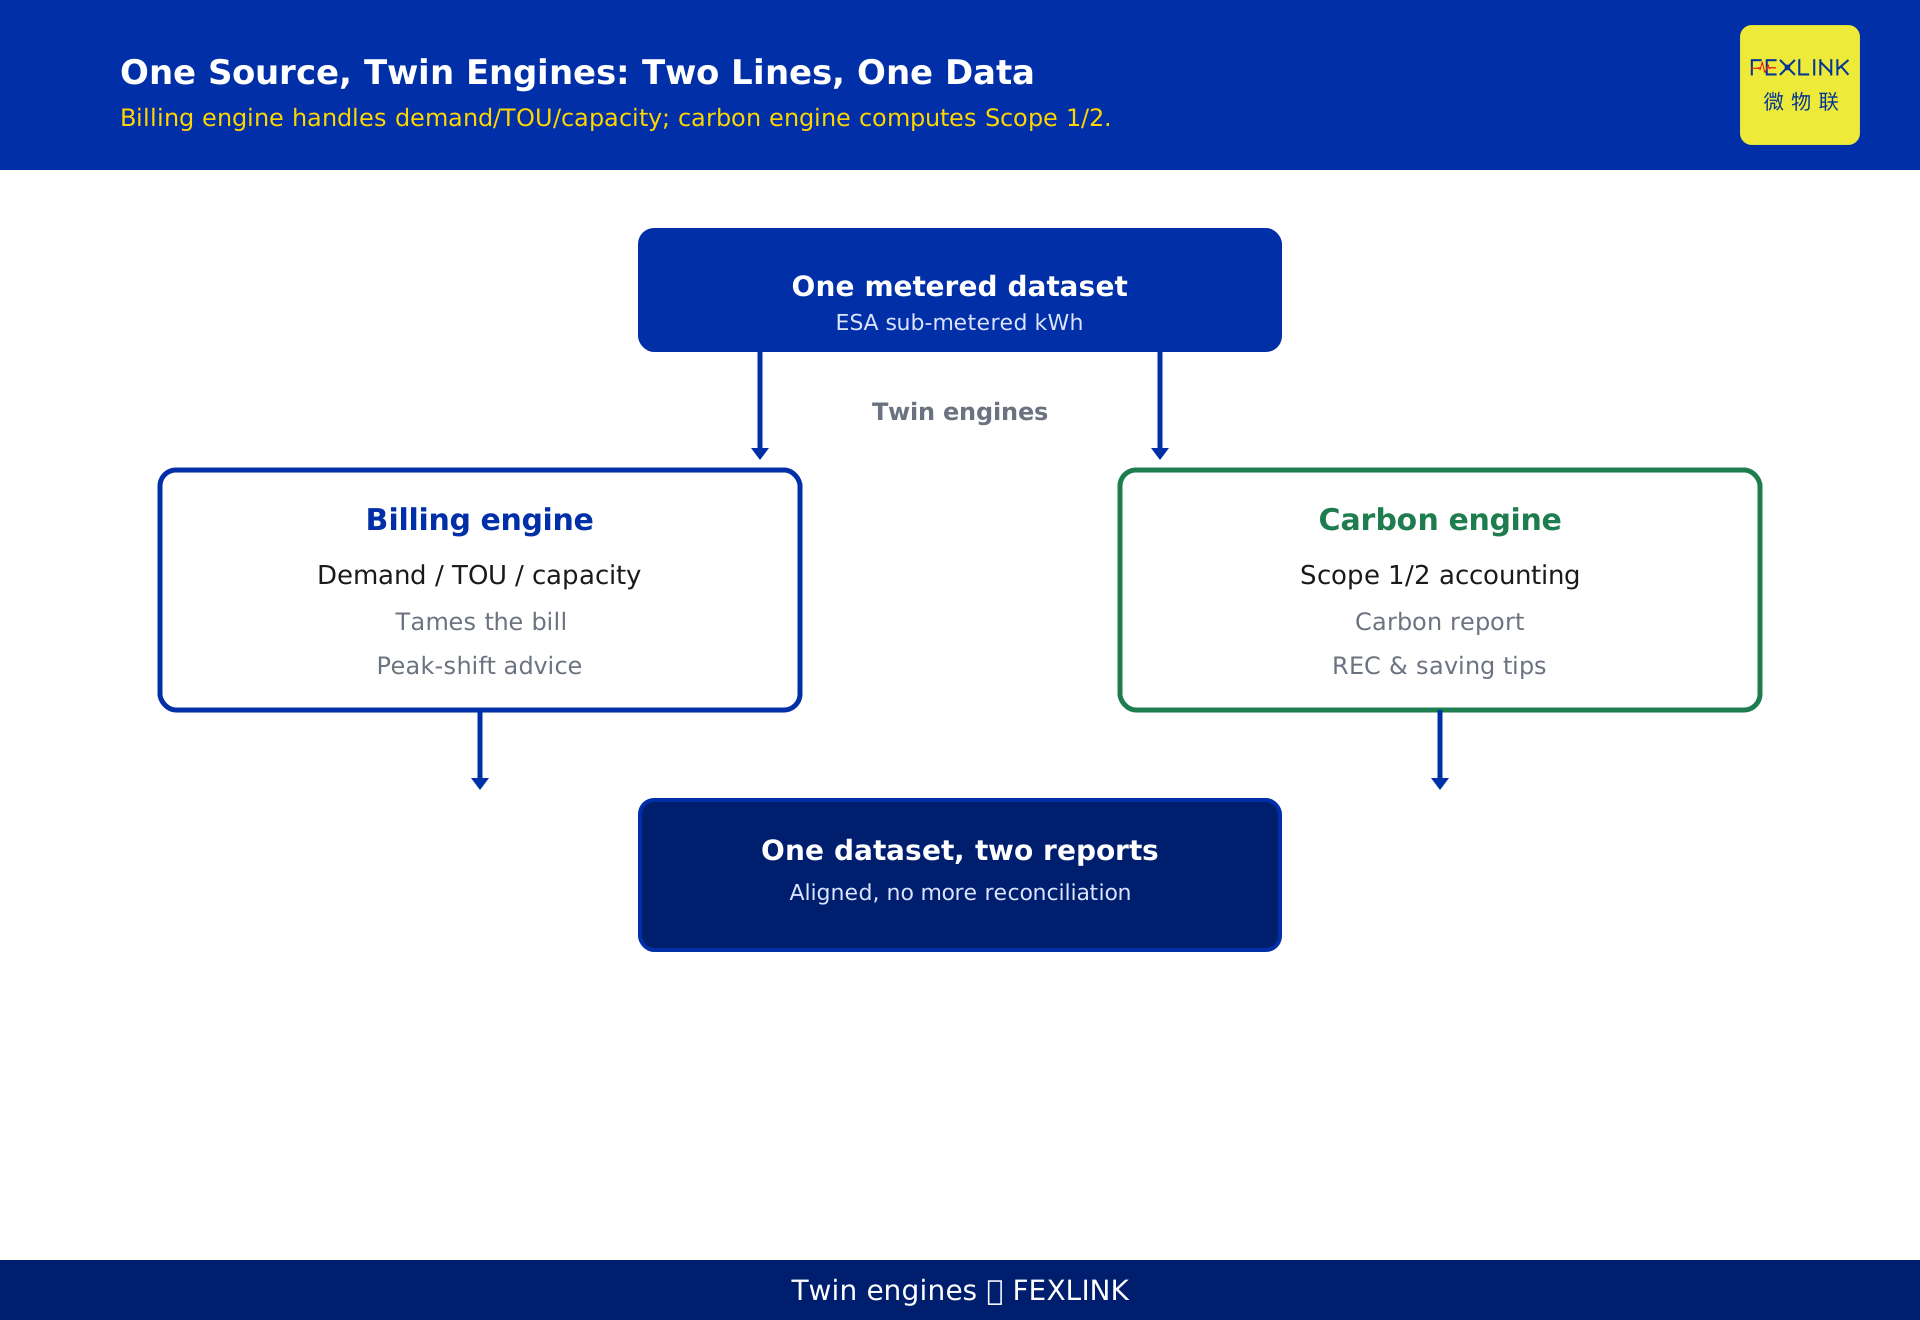
How do you build an integrated electricity-carbon management platform? One set of data manages both the electricity bill and carbon: Electricity and carbon are two sides of the same energy account—one set of metering data, two engines in parallel: the electricity engine manages demand, peak/valley, and capacity—the carbon engine handles Scope 1/2 accounting—a four-layer architecture: sensing (meters), edge (gateways), platform (data hub), and applications (electricity bill plus carbon report)—build in three steps: meter first, then engines, then optimization—one data set, double value.
A scenario: A group ran electricity bill management and carbon reporting as two separate systems—each calculated its own numbers and the results did not match—after integration: one set of meter data, the electricity bill saved and carbon reduced. The logic is that electricity-carbon integration is "one data set, two engines"—shared at the base, separated at the top.
An analogy — Integration is like weighing one object on two scales: the electricity bill asks how much you use, carbon asks how high the emissions are—the same number, two purposes—if the scale is accurate, both are accurate.
1. Why Integrate: The Pain of Two Ledgers
The pain today — the electricity system manages electricity: demand, peak/valley, and fees; the carbon system manages carbon: factors, accounting, and reports—two data sets and two calibrations; The data conflict — the same meter: the electricity system calculates one value and the carbon system calculates another—they do not match: disputes over billing checks and carbon reports; The management gap — actions to cut the bill: staggering and peak-shaving—actions to cut carbon: green power and conservation—two departments working separately without coordination; The wasted investment — two metering systems: duplicate investment; two platforms: duplicate construction; inconsistent data: repeated checks; The value of integration — one metering system: saving investment; one data set: unified calibration; two engines: electricity and carbon managed together.
In one sentence: two ledgers fight over data and break management—integration uses one metering system, one data set, and two engines together.
Two ledgers vs. integration table:
| Dimension | Two ledgers | Integration |
|---|---|---|
| Metering | Duplicate | One meter |
| Data | Conflicting | Unified |
| Management | Separate | Coordinated |
| Value | Single | Double |
An example — A group's electricity bill and carbon did not match: in the same month, the electricity system showed 8.20 million kWh and the carbon system showed 8.15 million—the check found different reading calibrations—after integration, one metering system made the data consistent. The logic is that integration solves "data fighting"—one data set, both sides correct—with unified calibration, the accounts are clear.
2. The Overall Architecture: Four Layers
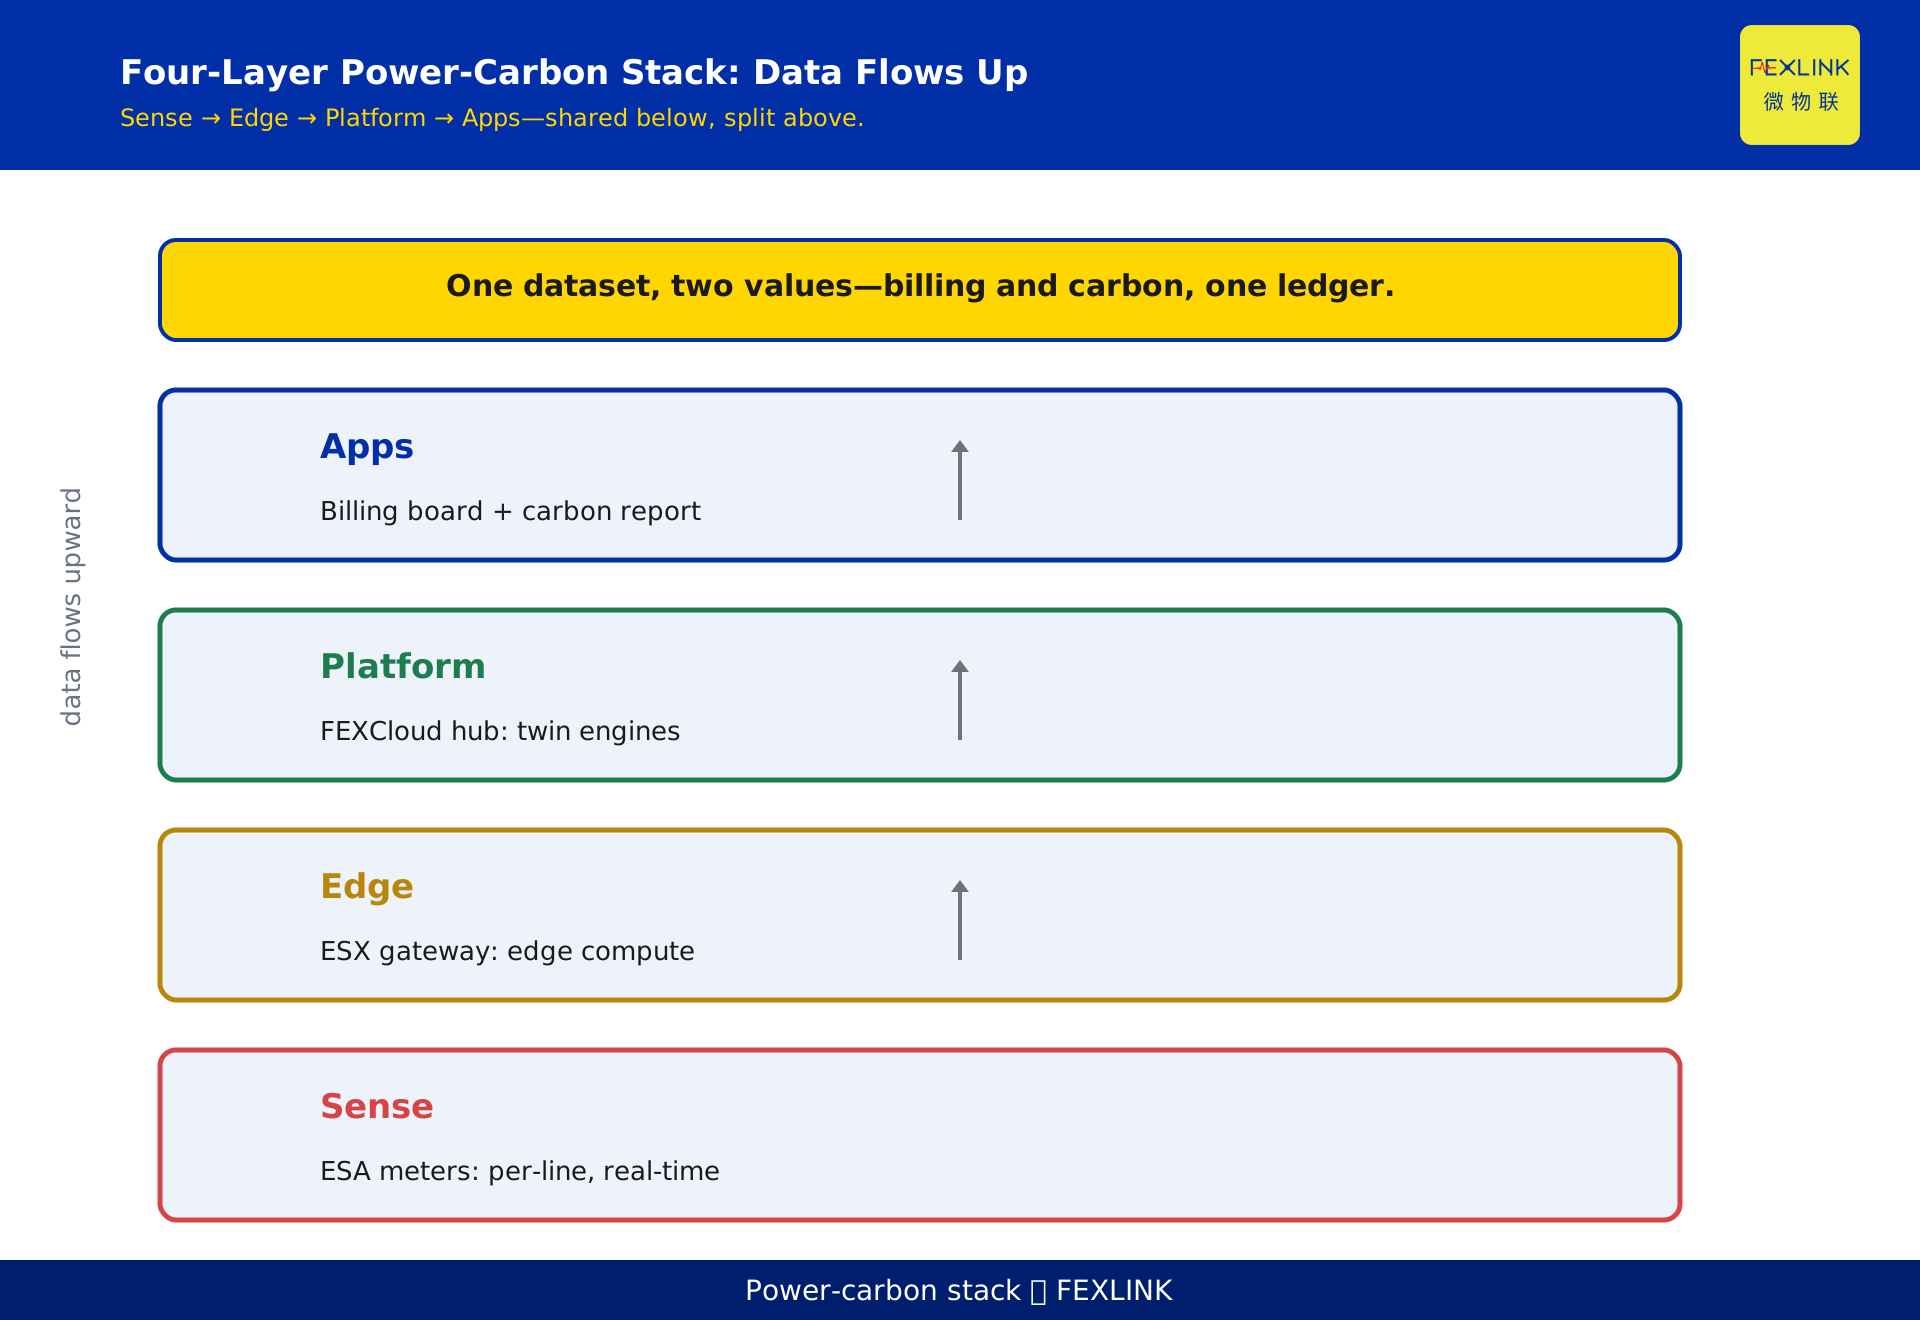
The sensing layer — smart meters: complete collection of electricity data; per-line and per-equipment: fine granularity; real-time collection: seconds to minutes; The edge layer — edge gateways: local computing; data preprocessing: cleaning and aggregation; offline continuity: no data loss; The platform layer — the data hub: unified storage; two engines: the electricity engine plus the carbon engine; shared data: one data set, multiple uses; The application layer — the electricity dashboard: demand, peak/valley, and fees; the carbon report: Scope 1/2 accounting; coordinated recommendations: peak-shaving plus carbon reduction; In one sentence: four layers—sensing collects, the edge computes, the platform manages, and applications use—one data chain, two application layers.
Four-layer architecture table:
| Layer | Role | Tool |
|---|---|---|
| Sensing | Collection | Smart meter |
| Edge | Preprocessing | Edge gateway |
| Platform | Storage+engines | Data hub |
| Applications | Bill+carbon | Two dashboards |
An example — A park deployed four layers: ESA meters collected at the sensing layer, ESX gateways preprocessed at the edge, two engines ran in parallel at the platform, and the application layer delivered bill and carbon dashboards—one data chain. The logic is that architecture is "layers working together"—each layer does its job—data flows up and value flows down.
3. How to Manage Data: One Data Set, Two Engines
One data set — one source: meter data; unified cleaning: consistent units and timestamps; unified storage: one data set, multiple uses; Two engines — the electricity engine: calculates demand, peak/valley, and capacity fees; the carbon engine: calculates Scope 1/2 emissions—both engines read the same data; The relationship of the engines — parallel without conflict: each calculates its own; shared basic data: consumption, periods, and load; results can cross-check each other; Data governance — unified calibration: one number for bill and carbon; quality checks: fill missing data and mark anomalies; version management: traceable calibration changes; In one sentence: one data set and two engines—the electricity and carbon engines read the same data—unified calibration makes the results verifiable.
Data management table:
| Step | Practice | Effect |
|---|---|---|
| Collection | One meter | One data set |
| Cleaning | Unified | Consistent |
| Engines | Parallel | Double value |
| Governance | Checked | Trustworthy |
An example — A plant integrated data: ESA meters collected once—the electricity engine calculated peak/valley fees and the carbon engine calculated emissions—both read the same data and the results confirmed each other. The logic is that data management is "one source, multiple uses"—one data set feeds two engines—with one source, the results agree.
4. The Electricity Engine: Manage Three Ledgers
The demand ledger — maximum demand: the 15-minute sliding window; peak-shaving: staggering, shifting, and load control—saving basic charges; The peak/valley ledger — time-of-use pricing: peak hours cost more; shifting: move high loads to valley hours—saving energy charges; The capacity ledger — capacity vs. demand: two billing methods; load-factor analysis: which is better—optimizing basic charges; In one sentence: the electricity engine manages three ledgers—demand, peak/valley, and capacity—shave the peak and shift the valley: the bill saves and carbon drops too.
Electricity engine table:
| Ledger | Action | Effect |
|---|---|---|
| Demand | Peak-shaving | Save basic charge |
| Peak/valley | Shifting | Save energy charge |
| Capacity | Choose billing | Optimize charges |
An example — A plant's electricity engine: staggered starts reduced demand, high loads moved to valley hours, and load-factor analysis selected demand billing—monthly bill savings of 8%. The logic is that the electricity engine is a "money saver"—manage three ledgers together—lower the peak and shift the valley, and the bill saves naturally.
5. The Carbon Engine: Calculate Two Types of Carbon
Scope 2 electricity carbon — consumption times the grid factor: the location-based method; purchased-power certificates offset: the market-based method—master both calibrations; Scope 1 fuel carbon — natural gas and diesel: fuel times emission factors; direct combustion on site; included in the enterprise carbon account; The accounting flow — activity data collection: electricity, gas, and oil; factor selection: the official current-year value; calculation and aggregation: produce the carbon report; In one sentence: the carbon engine calculates two types of carbon—Scope 2 electricity carbon and Scope 1 fuel carbon—shaving, green power, and conservation together cut carbon.
Carbon engine table:
| Calibration | Calculation | Scenario |
|---|---|---|
| Scope 2 | kWh × factor | Purchased electricity |
| Scope 1 | Fuel × factor | On-site combustion |
| Market | Certificate offset | Green power |
An example — A group's carbon engine: consumption times the current-year factor for Scope 2, gas volume times the factor for Scope 1, and green power certificates offset—the report came out under both calibrations. The logic is that the carbon engine is a "carbon calculator"—both types of carbon, both calibrations—only when it calculates clearly can you reduce effectively.
6. The Coordinated Value: Bill Saved Plus Carbon Reduced
The mechanism of coordination — one action, double value: peak-shaving saves the bill and cuts carbon; shifting to the valley saves the bill and cuts carbon; retrofit projects help both; Quantifying the coordination — how much the bill saves: by the electricity bill; how much carbon drops: by the carbon report—watch both indicators together; Coordinated scenarios — demand management: basic charges saved and peak carbon reduced; peak/valley optimization: energy charges saved and valley green power used; green power procurement: market-priced electricity and carbon offsets; In one sentence: coordination is "one action, double return"—decisions look at double returns.
Coordinated value table:
| Action | Bill | Carbon |
|---|---|---|
| Peak-shaving | Save | Drop |
| Shifting | Save | Drop |
| Green power | Market | Offset |
An example — A park's coordinated retrofit: staggered starts, valley production, and green power—10% bill savings and 12% carbon reduction. The logic is that coordination is a "multiplier"—double returns make investment more valuable.
7. The Build Path: Three Steps
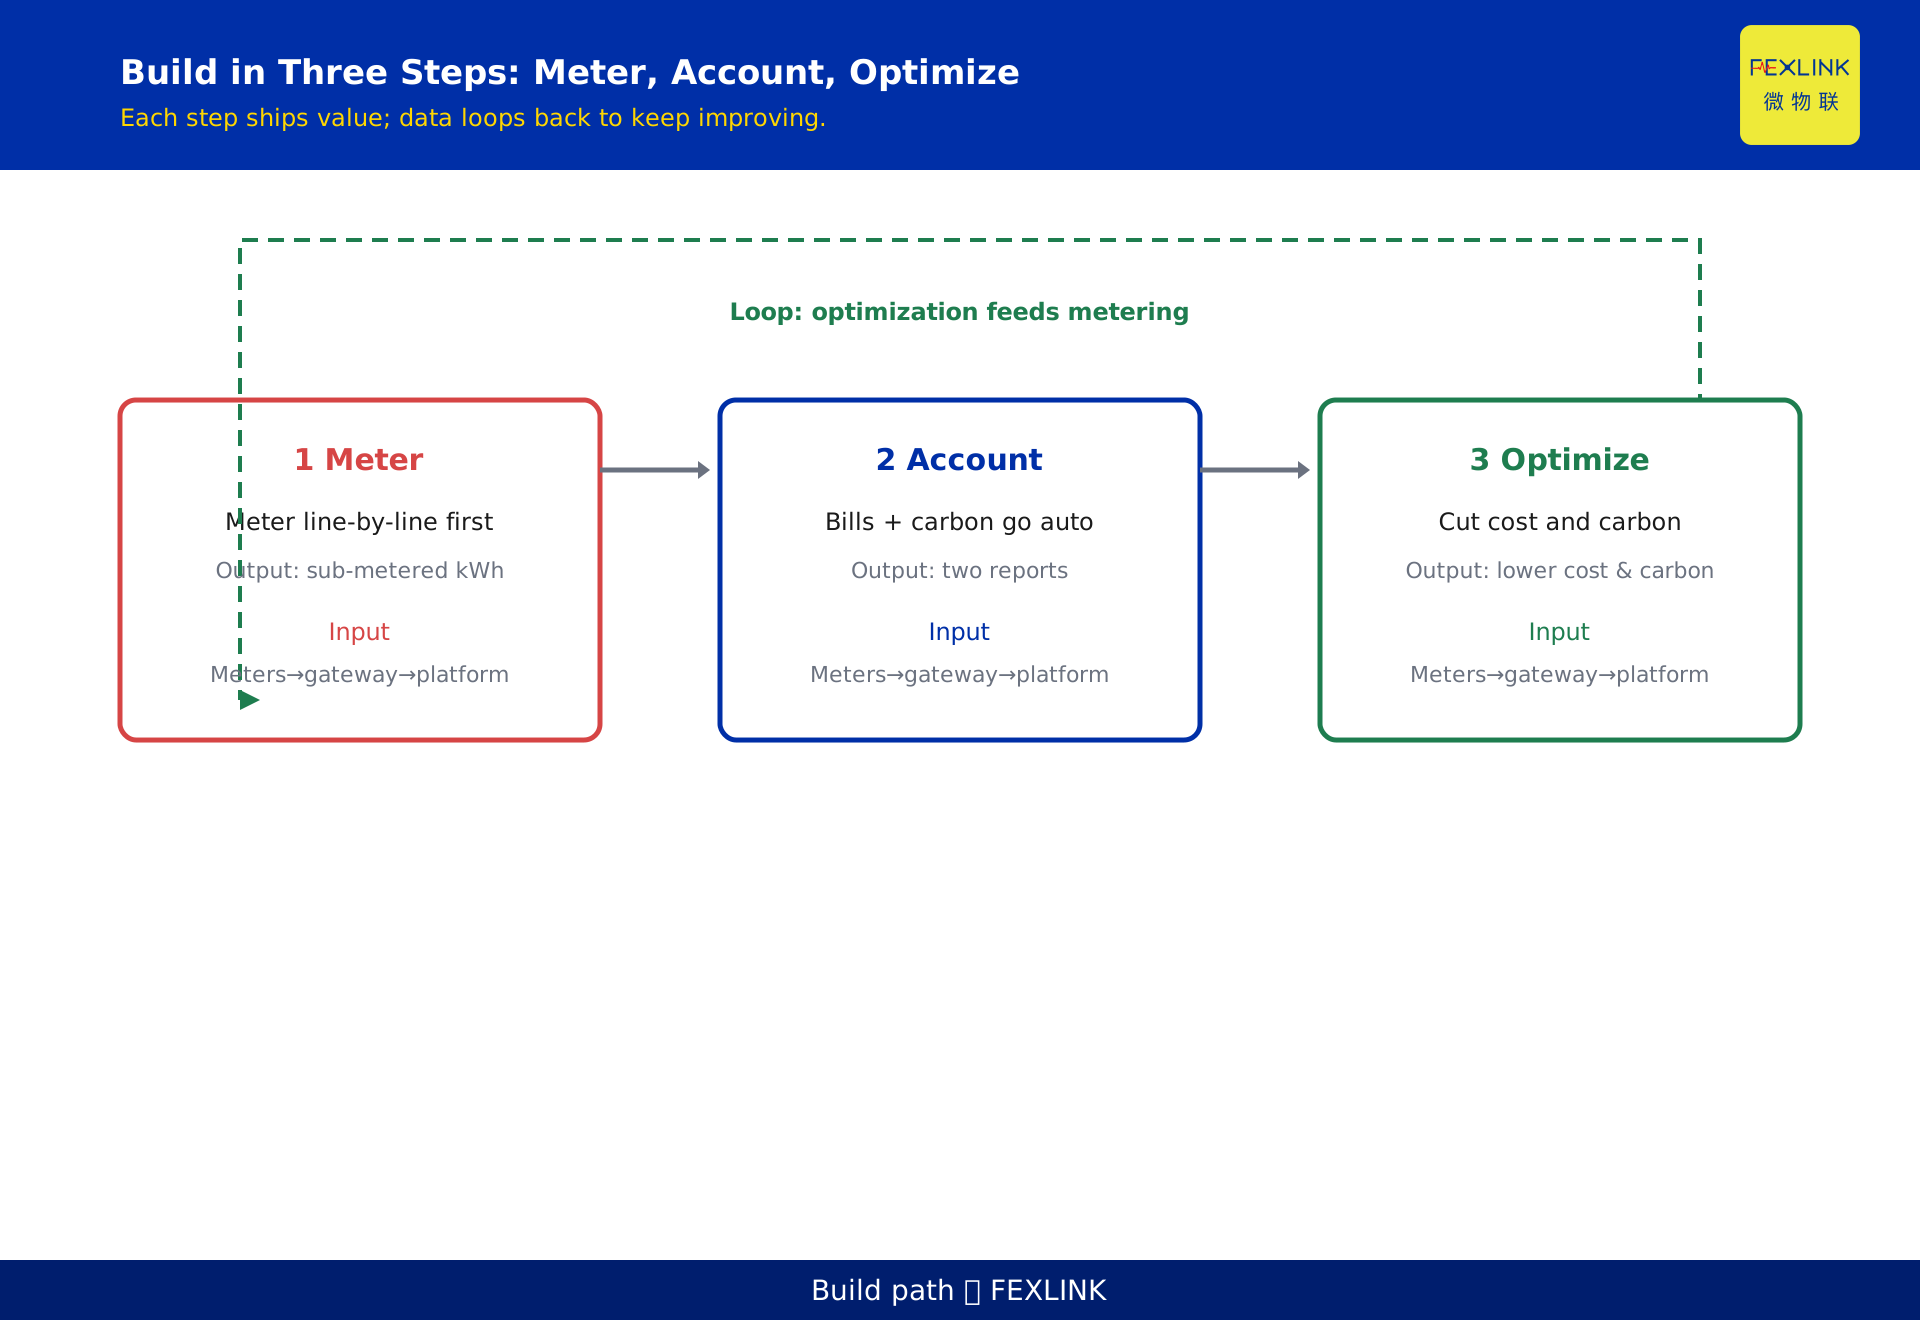
Step one: metering first — install meters completely: per-line and per-equipment; collect the data: seconds to minutes; ensure data quality: check and fill; Step two: two engines online — the electricity engine: demand, peak/valley, and capacity ledgers; the carbon engine: Scope 1/2 accounting; data interoperability: one data set, two engines; Step three: coordinated optimization — peak-shaving and shifting: manage bill and carbon together; green power procurement: market-method offsets; continuous iteration: monthly reviews and annual optimization; In one sentence: three steps—meter first, engines second, optimization third—each step produces a result, steady and solid.
Build path table:
| Stage | Action | Output |
|---|---|---|
| Step 1 | Metering | Complete data |
| Step 2 | Two engines | Bill+carbon reports |
| Step 3 | Optimization | Double return |
An example — A group took three steps: full meter coverage in phase one, two engines online in phase two, and coordinated optimization in phase three—a year later, 8% bill savings and 10% carbon reduction. The logic is that the path is "progressive"—metering is the base, engines are the core, and optimization is the goal—step by step, landing steadily.
8. Landing Support: How the Product Family Fits
Sensing support — the ESA full-element smart meter: per-line and per-equipment, real-time collection—the data foundation; Edge support — the ESX intelligent edge gateway: local computing and offline continuation—edge processing without data loss; Platform support — the FEXCloud IoT cloud platform: the data hub and two engines—integration in one platform; Accounting support — Tianyan E-09 (carbon accounting): built-in factors and automatic calculation—automatic reports with compliant calibrations; In one sentence: the product family fits by layer—ESA collects, ESX computes, FEXCloud manages, and Tianyan E-09 accounts for carbon—four pieces, integrated landing.
Product family table:
| Layer | Product | Role |
|---|---|---|
| Sensing | ESA meter | Data collection |
| Edge | ESX gateway | Local computing |
| Platform | FEXCloud | Two engines |
| Accounting | Tianyan E-09 | Automatic carbon |
An example — A park integrated in one go: ESA meters collected everything, ESX gateways computed at the edge, FEXCloud ran two engines, and Tianyan E-09 produced carbon reports automatically—four pieces in one configuration. The logic is that landing is a "product combination"—configure by layer, each doing its job—with the chain complete, integration works.
Back to the energy-carbon autonomy system — this is how the solution lands: the ESA full-element smart meter collects electricity data, the ESX intelligent edge gateway preprocesses locally, the FEXCloud IoT cloud platform runs two engines in parallel, and Tianyan E-09 carbon accounting produces reports automatically—the integrated electricity-carbon platform: one data set that manages both the electricity bill and carbon—one of the landing forms of the energy-carbon autonomy system 4×3×2.
Scope and Limitations
- The conclusions in this article are intended for LV distribution and electrical-safety sites. Standard numbers (GB/T 32150) refer to their currently effective editions, and product parameters follow the latest FEXLINK selection handbook and product knowledge base.
- Quantitative criteria (protection zone, discharge and residual voltage, earth resistance, thresholds and grading) hold under the preconditions stated in this article. Where the site voltage level, earthing arrangement, environmental category or load profile differs, the figures must be recalculated. Specific configurations involving ESA all-element smart meter, ESX intelligent edge computing gateway, Tianyan E-09 (carbon accounting) should be verified against actual circuit parameters.
- Specific product models and parameters are subject to the latest selection handbook and product knowledge base; this article does not constitute selection or procurement advice.
- Standard numbers cited here refer to the currently effective editions; when a standard is revised, the related quantitative conclusions must be re-checked.
- Deployment and implementation for specific projects must be carried out by qualified engineers based on site survey and design drawings.
Frequently Asked Questions
Building an Integrated Electricity-Carbon Platform
One set of data manages both the electricity bill and carbon: Electricity and carbon are two sides of the same energy account—one set of metering data