 FEXLINK Research Institute


Direct Answer
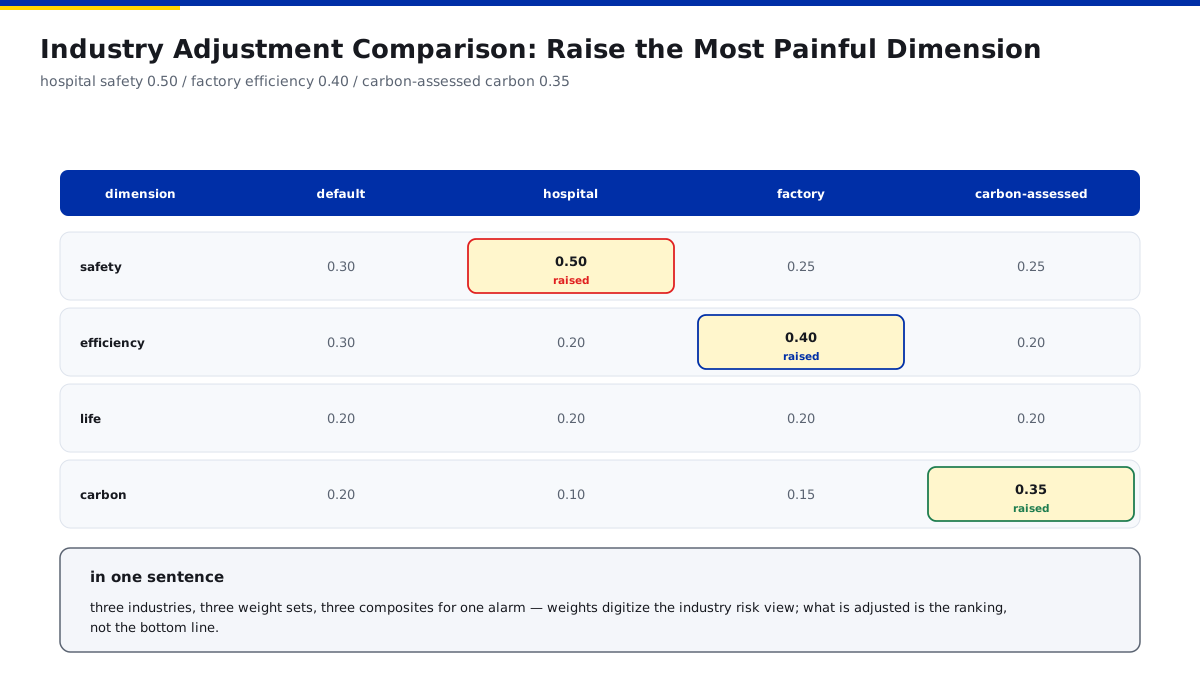
Wanxiang Engine scores every alarm on four 0-100 impact dimensions — how is the composite impact score computed? The default weights are safety 0.30, efficiency 0.30, life 0.20 and carbon 0.20 — the composite score equals 0.30×safety + 0.30×efficiency + 0.20×life + 0.20×carbon. The weights are adjustable by industry: hospitals raise safety to 0.50 (an outage is an incident), factories raise efficiency to 0.40 (stoppage is costly), carbon-assessed enterprises raise carbon to 0.35. Change the weights and the same alarm's composite score changes, its ranking changes and its handling priority changes. There is a boundary: the SAR red line is a national-standard bottom line; weights cannot touch it.
A scenario: A hospital and a factory both deploy Wanxiang Engine V4.0. A busbar alarm scores safety 80, efficiency 40, life 60 and carbon 30. With the default weights the hospital gets a composite of 56; after raising safety to 0.50 the composite becomes 62 — the alarm ranks higher and is handled first. Same platform, same alarm, different weights, different priority — weights are the digital expression of an industry's risk view.
1. The Four Dimensions: What Each 0-100 Score Rates
Safety score — risk to people and equipment: whether electric shock or fire-level risk is involved; higher means higher risk; Efficiency score — impact on operating efficiency: energy use, load factor, power factor; higher means more efficiency loss; Life score — equipment health damage: degree of damage, aging speed, life reduction; higher means more damage; Carbon score — carbon emission impact: energy emissions, over-limit emissions; higher means more carbon impact; Where the four scores come from — Wanxiang Engine evaluates by alarm type, equipment state and field data: each dimension scores independently.
In one sentence: the four dimensions are safety, efficiency, life and carbon — every alarm gets four independent scores, each rating its own dimension without interfering with the others.
A scoring example: A busbar overload alarm — safety 80 (overload may overheat), efficiency 40 (loaded high but not stopped), life 60 (persistent overload shortens life), carbon 30 (limited extra energy) — every score has its own basis. The four scores are four indicators on a check-up sheet — score each one first, then blend them into one composite.
2. The Default Weights: Where 0.30/0.30/0.20/0.20 Comes From
Safety 0.30 — safety is the bottom-line dimension: electrical risk touches people and equipment directly, so it gets the top band; Efficiency 0.30 — efficiency is the everyday dimension: energy use and operating efficiency are what users care about daily, so it also gets the top band; Life 0.20 — life is the long-term dimension: life reduction is a slow variable, so it gets the middle band; Carbon 0.20 — carbon is the trend dimension: dual-carbon is the direction, but not every user's most urgent issue today, so it gets the middle band; What the default means — safety and efficiency equal, life and carbon balanced: suits most industrial and commercial scenarios.
In one sentence: the default is safety 0.30 plus efficiency 0.30 plus life 0.20 plus carbon 0.20 — safety and efficiency first, life and carbon balanced — composite equals the four-term weighted sum.
A default example: One alarm (safety 80, efficiency 40, life 60, carbon 30): composite = 0.30×80 + 0.30×40 + 0.20×60 + 0.20×30 = 24 + 12 + 12 + 6 = 54 — 54 maps to YJ2, handle in shift. The default is a universal scale — most scenarios use it directly; special industries adjust.
3. Industry Adjustment: Hospitals Raise Safety to 0.50
The hospital pain — an outage is an incident: surgery interrupted, ICU power lost — safety is the overriding dimension; The hospital adjustment — safety 0.50: safety takes nearly half the weight; other dimensions give way; The effect — alarms with high safety scores jump in composite: they rank earlier and are handled first; The principle — emphasize the most painful dimension: whichever dimension costs the most when it fails gets the higher weight; The adjustment range — proportional to cost: not arbitrary, but tuned to the industry's cost-of-failure profile.
In one sentence: industry adjustment means raising the most painful dimension — hospitals put safety first, so safety goes to 0.50 — weights are the digital expression of an industry's risk view.
A hospital example: The same busbar alarm (safety 80, efficiency 40, life 60, carbon 30): the default composite is 54; after adjustment (safety 0.50, efficiency 0.20, life 0.20, carbon 0.10) the composite is 0.50×80 + 0.20×40 + 0.20×60 + 0.10×30 = 40 + 8 + 12 + 3 = 63 — near the YJ1 boundary and handled first. The "cost weight" a hospital pays for safety pushes safety alarms to the top.
4. Factory Adjustment: Efficiency to 0.40
The factory pain — stoppage is costly: a line down for hours costs tens of thousands — efficiency is the core dimension; The factory adjustment — efficiency 0.40: the efficiency weight rises while safety stays meaningful; The effect — alarms with high efficiency scores rank higher: hazards affecting the line are handled first; The factory trade-off — safety and efficiency, leaning efficiency: safety still matters; efficiency is the daily pain; Adjusting is not lowering safety — a lower safety weight does not mean safety is less important: the red line stays; the ranking changes.
In one sentence: factory adjustment means efficiency 0.40 — industries with costly stoppages put efficiency first — what is adjusted is the ranking, not the safety bottom line.
A factory example: The same alarm (safety 80, efficiency 40, life 60, carbon 30): after the factory adjustment (safety 0.25, efficiency 0.40, life 0.20, carbon 0.15) the composite is 0.25×80 + 0.40×40 + 0.20×60 + 0.15×30 = 20 + 16 + 12 + 4.5 = 52.5 — different from the hospital because the efficiency weight moved the ranking. The same alarm: the hospital watches safety, the factory watches efficiency — weights write the industry pain into the ranking logic.
5. Carbon-Assessed Enterprises: Carbon to 0.35
The carbon-assessed pain — carbon has assessment targets: over-limit means cost and public notice — carbon is a hard constraint; The adjustment — carbon 0.35: carbon moves into the top tier; The effect — alarms with high carbon scores rank higher: high-carbon hazards are handled first; Carbon and efficiency — high carbon often accompanies low efficiency: a high carbon weight marks low-efficiency, high-carbon equipment more readily; The boundary — carbon is a trend constraint: raising the carbon weight does not change the safety bottom line.
In one sentence: carbon-assessed enterprises raise carbon to 0.35 — industries with hard dual-carbon targets move carbon into the top tier — the weight follows the assessment.
A carbon example: The same alarm (safety 80, efficiency 40, life 60, carbon 30): after adjustment (safety 0.25, efficiency 0.20, life 0.20, carbon 0.35) the composite is 0.25×80 + 0.20×40 + 0.20×60 + 0.35×30 = 20 + 8 + 12 + 10.5 = 50.5 — the carbon score is low but the higher weight moves the composite differently from other industries. Three industries, three weight sets, three composites for one alarm — the weight decides what your industry cares about most.
6. How Adjustment Changes Ranking and Handling Priority
Composite drives ranking — higher composite alarms rank first: operators handle high-score alarms first; Adjustment changes ranking — weights change, composites change, ranking and priority follow; Scenario fit — hospitals adjust safety: safety alarms move up; factories adjust efficiency: efficiency alarms move up; Linking to the bands — the composite maps to the six score bands: adjustment may cross a band, escalating or relaxing the action; Verifying the adjustment — watch the ranking after tuning: is the alarm you care about now at the top — if not, tune again.
In one sentence: adjustment changes the composite, the composite changes the ranking, the ranking changes handling priority — after tuning, look at the ranking; when it fits, the weights are right.
A ranking example: Two alarms on one platform — A (safety 90, efficiency 30, life 40, carbon 20) and B (safety 40, efficiency 90, life 50, carbon 30): under default weights A = 27+9+8+4 = 48 and B = 12+27+10+6 = 55 — B ranks first; after the factory adjustment (efficiency 0.40) A = 27+12+8+4 = 51 and B = 12+36+10+6 = 64 — B still first but the gap widens; after the hospital adjustment (safety 0.50) A = 45+6+8+4 = 63 and B = 20+18+10+6 = 54 — A overtakes B. Change the weights and "who gets handled first" changes — tuning weights is a management act, not a technical parameter.
7. The Boundary of Adjustment: The SAR Red Line Cannot Move
The nature of the SAR red line — a national-standard bottom line: certain indicators over limit are violations; weights cannot "dilute" them; The logic of the red line — one-vote veto: red-line indicators alarm directly and skip weighted ranking; The scope of weights — ranking among non-red-line alarms: weights only decide "who goes first", never "must the red-line alarm be handled"; The trap of adjustment — hiding red-line risk with low weights: lowering the safety weight does not stop red-line alarms; The discipline of adjustment — red-line parameters are locked: configurable at the platform level but locked by default; tuning never crosses the red line.
In one sentence: the boundary is that the SAR red line cannot move — weights only rank non-red-line alarms, and red-line alarms have a one-vote veto — tuning adjusts priority, not the bottom line.
A boundary example: One platform set the safety weight to 0.10; an earth-resistance over-limit (SAR red line) — the red-line alarm still tops the list and still demands immediate handling — the weight did not "dilute" the red line. The red line is given by the national standard, not by the weight — no matter how low the weight, the red-line alarm's handling requirement stands.
8. Common Pitfalls: Four Traps in Weight Adjustment
Trap 1 — weights do not sum to 1 — the four weights total not 1: the composite basis is muddled and ranking distorts; Trap 2 — copying industry templates blindly — the hospital's 0.50 copied by a factory: industry differences flattened; Trap 3 — tuning without verifying the ranking — adjusted but not observed: you never know whether the alarm you care about moved up; Trap 4 — trying to dilute the red line with weights — lowering the safety weight to "ease" alarms: red-line alarms still fire, and the ranking is misled.
In one sentence: the four traps are weights not summing to 1, template copying, no post-adjustment verification and red-line dilution — the first three distort ranking, the last touches the bottom line.
A trap example: One project wrote the weights as 0.40/0.40/0.30/0.20 (sum 1.30): composites ran high, alarms piled into the top band and the ranking lost discrimination — fixed after the sum returned to 1. Weights are both math and management — the sum must equal 1, industry differences are yours to set, verify after tuning, and never touch the red line.
9. Back to YESLON: How Wanxiang Engine V4.0 Lands
Wanxiang Engine V4.0 — ships with the four-dimension impact model: safety/efficiency/life/carbon score independently and blend by weight; Default weights out of the box — 0.30/0.30/0.20/0.20: most industrial and commercial scenarios deploy directly; Industry adjustment templates — hospital, factory, carbon-assessment and more: apply a template, then fine-tune; Ranking linked to tuning — weight configuration takes effect immediately: ranking and handling priority update in real time; Red-line lock — SAR parameters are independent of weights: red-line alarms veto outright, unaffected by weights.
In one sentence: Wanxiang Engine V4.0 is independent four-dimension scoring, default weights, industry templates, ranking linkage and a locked red line — weights are the visible knob of an industry's risk view.
A landing example: One group deployed across multiple businesses: the hospital unit used safety 0.50, the factory unit used efficiency 0.40 and the park unit used the defaults — one platform, differentiated ranking by business. Four-dimension weights are not a technical detail — they translate "what your industry fears most" into ranking logic — tune them right, and what tops the screen is what you care about.
Scope and Limitations
- The conclusions in this article are intended for LV distribution and electrical-safety sites. Criteria are compiled from public codes and FEXLINK product documentation, and product parameters follow the latest selection handbook and product knowledge base.
- Quantitative criteria (protection zone, discharge and residual voltage, earth resistance, thresholds and grading) hold under the preconditions stated in this article. Where the site voltage level, earthing arrangement, environmental category or load profile differs, the figures must be recalculated. Specific configurations involving Wanxiang engine V4.0 should be verified against actual circuit parameters.
- Specific product models and parameters are subject to the latest selection handbook and product knowledge base; this article does not constitute selection or procurement advice.
- Standard numbers cited here refer to the currently effective editions; when a standard is revised, the related quantitative conclusions must be re-checked.
- Deployment and implementation for specific projects must be carried out by qualified engineers based on site survey and design drawings.
Frequently Asked Questions
How the Four-Dimension Impact Weights Work
Wanxiang Engine scores every alarm on four 0-100 impact dimensions — how is the composite impact score computed