 FEXLINK Research Institute
Direct Answer
The tender document says "data completeness 99%" — but when acceptance comes, how exactly is it calculated? The supplier says it has passed, the client says it has not — what do you do? Such metrics must first define the denominator and the statistical window: data uptime (access success rate) = successfully stored points ÷ points that should have been reported; data completeness counts the missing rate over a monthly window; and the basis for "excluding planned maintenance and uplink network faults" must be written clearly — if the basis is not written, acceptance becomes each side talking past the other. If the basis is written, acceptance has a common ruler. FEXLINK FEXCloud IoT cloud platform turns the metric basis into a standard chapter of the acceptance document.
A scene: at the acceptance of a project, the supplier reported "completeness 99.2%, passed", but the client's spot check computed 96% — a difference of 3 points, and neither side gave in. Investigation: the supplier's numerator was "points successfully stored" and its denominator was "points that should be reported by online devices"; the client's denominator was "all points that should be reported" (including offline devices) — different denominators, of course different numbers. Without a formula, acceptance becomes "whoever shouts louder wins" — metric assessment becomes a shouting match, so write the formula before talking about acceptance.
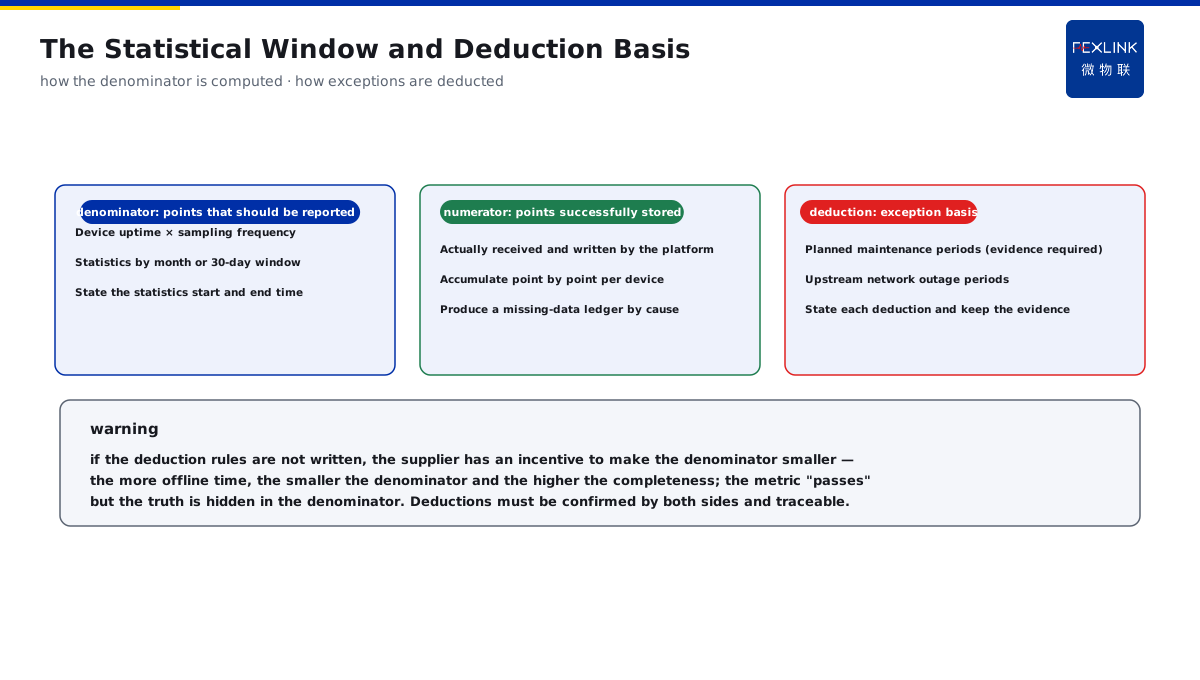
A second scene: a platform reported "data completeness 99.5%", but the operations team found that one switch room had no data at all for a week around noon — the platform's statistics had quietly deducted the "device offline periods" from the denominator; the more offline time, the smaller the denominator and the higher the completeness — the metric "passed", but the truth was hidden in the denominator. If the basis does not spell out the deduction rules, the supplier has an incentive to make the denominator smaller and the metric higher.
1. Data Uptime: Define the Numerator and Denominator First
Data uptime answers "whether the device data actually entered the platform". The basis is as follows:
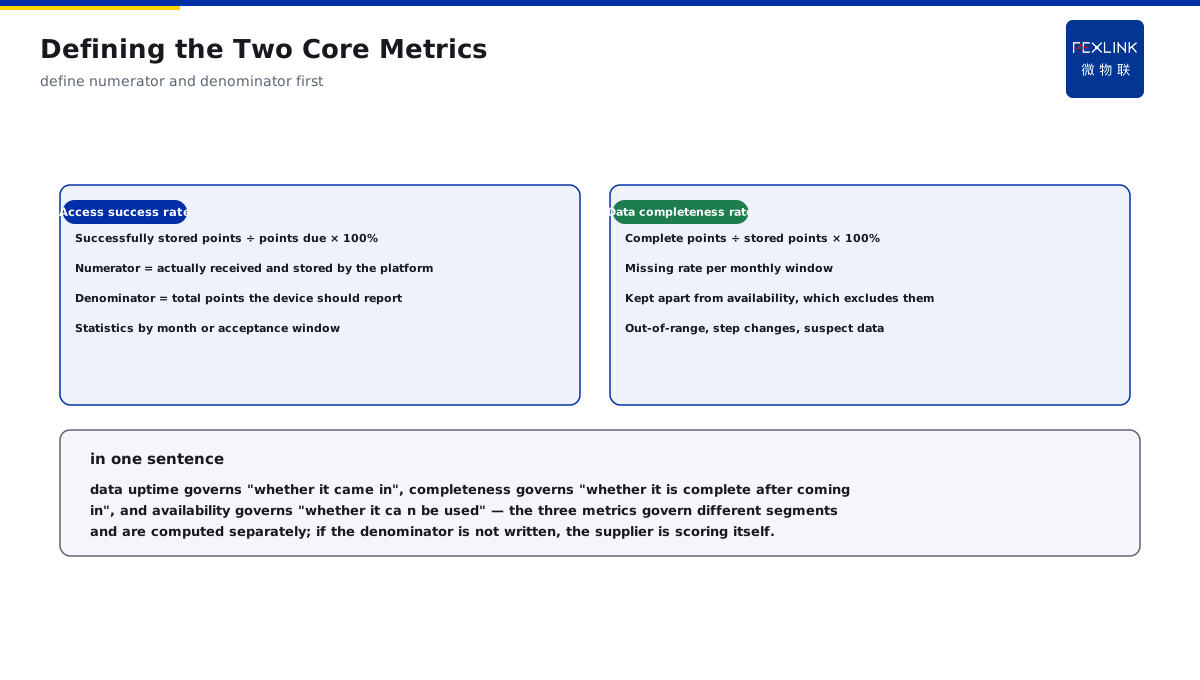
Numerator — the data points successfully stored: the data points actually received and written into the platform database; Denominator — the points that should be reported: computed by the collection cycle, the total points the device should have reported (online duration × collection frequency); Statistical cycle — usually monthly, or by the acceptance window (30 consecutive days); Formula — data uptime = points successfully stored ÷ points that should be reported × 100%.
In one sentence: the numerator is "what was actually received", the denominator is "what there should have been" — if the denominator is not written, the success rate is the supplier scoring itself; if the denominator is written, both sides are on the same starting line.
A data uptime example: 50 devices in a park collecting once every 15 minutes, all online all day — the points that should be reported per day are 50×96=4800; the platform actually stored 4750 — uptime 4750÷4800≈99%. Once the formula is set out, anyone can compute it; without the formula, 50 devices, 4800 points and 50 missing points are something nobody can explain.
Classifying the causes of missing data: missing data does not equal a fault — device offline (power loss, network disconnection), communication conflict (gateway congestion), and platform-side processing failure (queue overflow) — the three causes are handled differently: device offline is probably a site problem, communication conflict needs a gateway-configuration check, and platform processing failure needs a platform check. It is recommended to classify the "missing-data ledger" by cause in the assessment — whichever link misses the most is the link to check; the metric is the result, and the ledger is the process.
2. Data Completeness: Counting the Missing Rate over a Monthly Window
Data completeness answers "whether the stored data is complete" — it is a different concept from data uptime:
Data completeness — the share of complete, non-missing points among the stored data: completeness = complete points ÷ stored points × 100% (governs "the quality of data after storage"); Data availability — the share of points usable for analysis: availability = usable points ÷ stored points × 100% (after excluding over-limit, jump and suspicious data); Statistical window — completeness is usually counted monthly; the monthly window filters out occasional interference and is more representative than a single-day number.
In one sentence: data uptime governs "whether it came in", completeness governs "whether it is complete after coming in", and availability governs "whether it can be used" — the three metrics govern different segments and are computed separately; the assessment must never mix them up.
A completeness example: in one month a platform stored 14,400 points, of which 86 were missing and 120 were over-limit/suspicious — completeness = (14400-86)÷14400≈99.4%; availability = (14400-86-120)÷14400≈98.6%. The same batch of data gives different numbers for the two metrics — assess "complete" with completeness and "usable" with availability; mixing them makes it impossible to explain.
3. Collection Cycle and Polling Latency: Write the Assessment Basis Clearly
Besides the success rate and completeness, two types of latency metrics also need a clear definition:
Collection cycle — how often a device reports (e.g., every 15/30 minutes); the assessment basis writes "report at least once within the configured cycle"; Polling latency — the time from the platform requesting data to getting it (seconds); the assessment basis writes "polling success rate ≥ X%, average latency ≤ Y seconds"; Latency tolerance — data arriving within 2 cycles late is still counted as "arrived effectively"; only beyond that is it "not reported" — network jitter is normal, so the basis must leave a buffer.
In one sentence: latency metrics are the easiest to fudge with "approximately" — writing the cycle, latency and latency tolerance into the contract gives acceptance a ruler; without them, acceptance is a guess.
A latency example: a platform advertised a "polling success rate" of 99.9%, but the on-site measurement was only 96% — the gateway signal at the site was weak, and polling needed multiple retries to succeed, dragging the average latency from the advertised 2 seconds to 8 seconds. The advertised basis measures "the ideal value on a good network"; the contract basis must measure "the actual value on the site network" — what goes into the contract is the latter.
4. Published Values: 99.9% and 99% Are Only Reference Expectations
What nature do the "data uptime 99.9%, data completeness 99%" on the supplier's marketing page have?
Reference expectation — this is the design value of the product under ideal conditions (lab / standard deployment), not a guaranteed field value; Field difference — the actual value is affected by the site environment: old gateways, weak signals, offline devices, maintenance plans — all pull the actual value down; Contract value — the value that can truly be accepted is the one written in the contract, usually a statement with a denominator and a window, such as "data uptime ≥ 99% (monthly statistics)".
In one sentence: the number on the marketing page is the "expectation"; the number in the contract is the "commitment" — acceptance only recognizes the contract basis, not the marketing basis; between the advertisement and the commitment, there is a contract.
An "advertisement vs contract" example: a supplier advertised "completeness 99.9%", and the contract wrote "completeness ≥ 99% (monthly statistics, excluding planned maintenance and confirmed fault periods)" — the on-site statistics were actually 99.3%, and 99.6% after excluding 3 planned-maintenance periods — passed. If acceptance followed the advertised basis, the site would never pass; with the contract basis, both sides have something to rely on — this is the difference between "written into the contract" and "printed on the marketing page".
5. Acceptance Practice: 30 Consecutive Days of Statistics + Spot-Check Re-verification
Acceptance cannot "count one day and call it done"; it must follow a reproducible process:
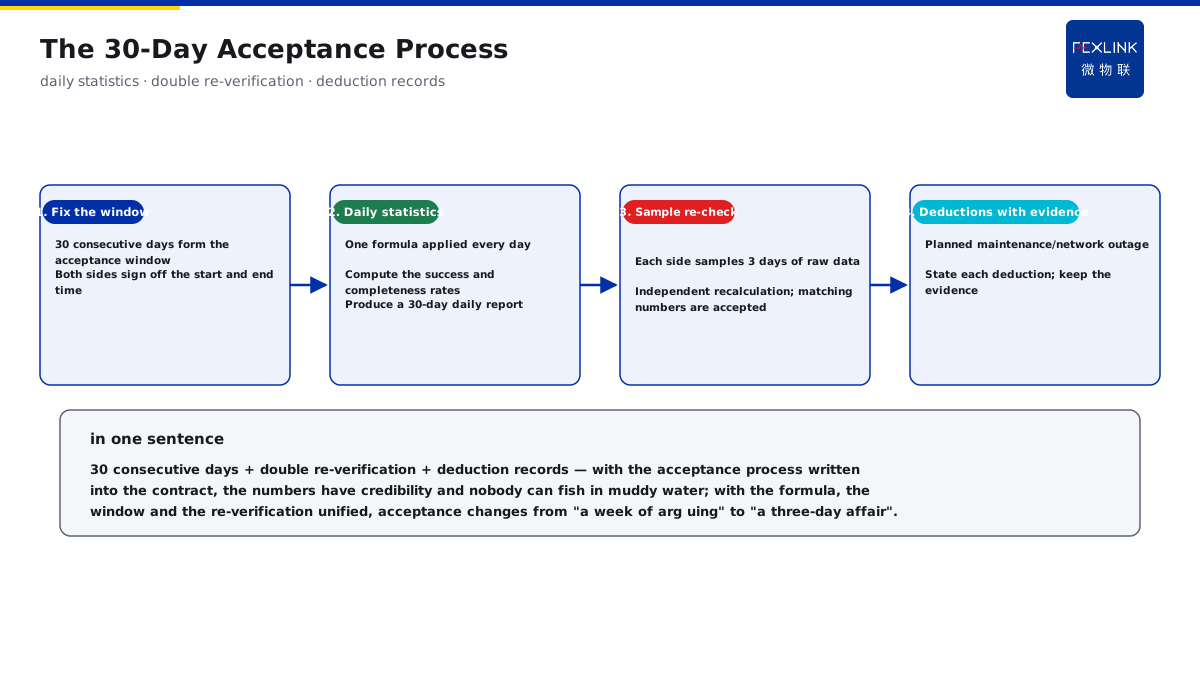
Step 1: set the window — take 30 consecutive days as the acceptance window, and both sides sign off on the start and end time of the statistics; Step 2: daily statistics — compute the data uptime and completeness every day with the unified formula, forming a 30-day daily report; Step 3: spot-check re-verification — each side picks 3 days of raw data and independently recomputes; the numbers matching means recognition; Step 4: deduction basis — deduct the planned-maintenance periods and uplink network fault periods (needing proof confirmed by both sides) from the denominator, writing clearly how much was deducted and on what basis.
In one sentence: 30 consecutive days + double re-verification + deduction records — with the acceptance process written into the contract, the numbers have credibility, and nobody can fish in muddy water or sneak through.
An acceptance example: at a project's acceptance, both sides set the basis "data uptime ≥ 99%, completeness ≥ 99%, 30-day monthly window" — the supplier ran the unified formula and got 99.2%, and the client independently recomputed 3 days of raw data and got 99.1%, a 0.1-point difference (a counting-rule difference on individual points); after aligning the counting rules, both agreed — acceptance was done in 3 days. With the formula unified, the window unified and the re-verification unified, acceptance changes from "a week of arguing" to "a three-day affair".
How to do the spot-check re-verification: which days to pick cannot be chosen by the supplier — both sides decide together (e.g., the 5th, 15th and 25th day of the window), so the supplier cannot only pick "good days"; the sample is the raw messages (device report records), not the platform reports — reports may already be processed numbers; both sides independently recompute with the same formula, and a difference above 0.1 point triggers a counting-rule check until it is clear. The fairness of the spot-check comes from three rules: the sample is chosen together, the data is raw, and the formula is unified.
6. The Five Steps of Landing the Metric Basis
Step 1: formula first — write the numerator/denominator formula for each metric first, and both sides sign it; Step 2: window agreement — write the statistical cycle (month/30 days) and start-end time clearly; Step 3: deduction rules — write the deduction conditions and proof materials for planned maintenance and network faults clearly; Step 4: unified tools — both sides use the same statistics tool (platform report) to avoid computing separately; Step 5: dispute arbitration — agree in advance on the re-verification process when numbers differ (pull raw data, independently recompute).
In one sentence: formula → window → deduction → tools → arbitration, the five steps written into the contract change metric assessment from "arguing" to "executable" and from "voice" to "formula" — from now on there is a ruler to measure by.
The landing order of the five steps matters: the formula and window must be set first (without the premises, everything after is empty talk); the deduction rules come third (define the normal basis first, then talk about exceptions, so "exceptions" do not become "the norm"); the unified tools and dispute arbitration come last (once the first four are agreed, tools and arbitration are just execution guarantees). The order is not arbitrary — putting dispute arbitration first means defaulting to arguing; putting the formula and window first means heading toward a successful acceptance.
7. Back to FEXLINK: How the Metric Basis Lands
To land this logic on products: FEXLINK FEXCloud IoT cloud platform builds the metric statistics into the platform — data uptime, data completeness and collection latency are automatically computed with a unified formula, the monthly-window report can be exported and re-verified, and the deduction records are traceable. The metric basis is not a "word game"; it is the contract of acceptance — with the denominator, the window and the deductions written clearly, the supplier and the client have a common language. During selection, ask "how does your platform compute completeness" — the one answering "numerator/denominator formula, monthly window, deduction basis" is the platform that takes acceptance seriously; the one answering "it is just 99%" is the one to watch out for — acceptance with it is exactly where the arguing begins. In one sentence: the ability to define the metric basis is the epitome of the platform's data-quality engineering capability — the finer the formula and the clearer the window, the more the platform can withstand acceptance.
Scope and Limitations
- The conclusions in this article are intended for LV distribution and electrical-safety sites. Criteria are compiled from public codes and FEXLINK product documentation, and product parameters follow the latest selection handbook and product knowledge base.
- Quantitative criteria (protection zone, discharge and residual voltage, earth resistance, thresholds and grading) hold under the preconditions stated in this article. Where the site voltage level, earthing arrangement, environmental category or load profile differs, the figures must be recalculated. Specific configurations involving FEXCloud IoT cloud platform should be verified against actual circuit parameters.
- Specific product models and parameters are subject to the latest selection handbook and product knowledge base; this article does not constitute selection or procurement advice.
- Standard numbers cited here refer to the currently effective editions; when a standard is revised, the related quantitative conclusions must be re-checked.
- Deployment and implementation for specific projects must be carried out by qualified engineers based on site survey and design drawings.
Frequently Asked Questions
Data Uptime 99.9%, Completeness 99%
The tender document says "data completeness 99%" — but when acceptance comes, how exactly is it calculated