 微物联研究院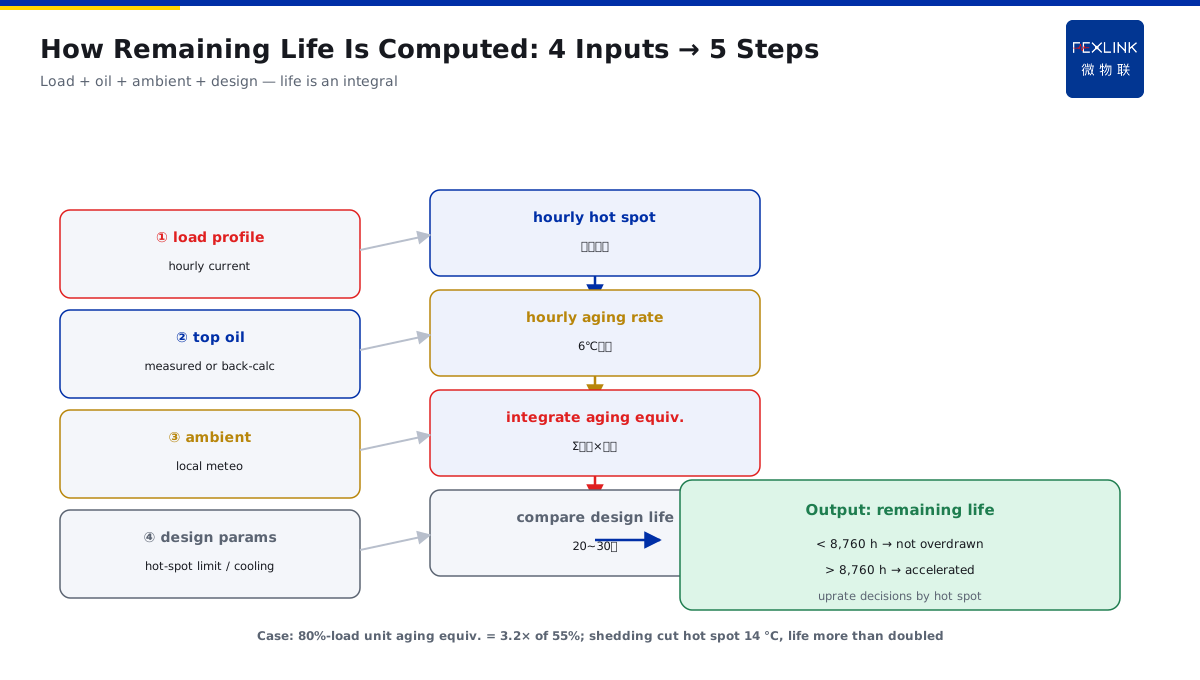
Direct Answer
How many more years can a transformer run safely? The answer: the winding hot-spot temperature decides, not the top oil temperature. Through a thermal-circuit model, top oil temperature, load current, and ambient temperature estimate the hot-spot temperature; every ~6 °C rise in hot-spot temperature roughly doubles the paper insulation aging rate — the "6 °C rule"; integrating the full-year load profile hour by hour yields remaining life and headroom for uprating.
A chemical plant's 110 kV main transformer ran at 65% load year-round; top oil held steady at 72 °C (far below the 85 °C alarm line), so operations felt "very safe." But a thermal-circuit assessment showed: on consecutive summer hot days, the winding hot-spot reached an estimated 108 °C (allowable 98 °C) — aging accelerated 5×. Running that load profile for 8 more years would exhaust insulation life early. Watching only top oil would have kept this risk underestimated forever.
Because:
- Top oil ≠ hot-spot: the hot spot runs 10–20 °C above top oil and is the hottest, fastest-aging location;
- Aging is set by the hot spot: insulation paper life follows the highest temperature it endures, not the average;
- 6 °C rule: every ~6 °C hot-spot rise roughly doubles the paper aging rate (engineering simplification of the Arrhenius relation);
- Thermal-circuit model estimates it: top oil + load current + ambient → hot-spot rise → remaining life.
Key insight: "oil temperature did not alarm" does not mean "the transformer is safe." Oil temperature is an average; the hot spot is the judge of life. To see remaining life, compute the hot spot first — not the oil.
A data center ran two identical transformers in rotation — one at 80% summer load, one at 55%. A thermal-circuit calculation over the quarterly load profile showed the 80% unit's annual aging equivalent was 3.2× the 55% unit's. They shifted critical load to the lightly loaded unit; the heavy unit's hot spot dropped 14 °C, extending estimated life by more than double — no equipment spend, just operating optimization from calculation.
1. Transformer Thermal Structure: Oil–Winding–Ambient
Transformer heat is not uniform; it conducts outward layer by layer from the winding center:
Heat source: winding copper loss (I²R) and iron loss, generated continuously in operation; Conduction path:
- Winding → insulation paper → oil → tank wall → ambient air;
- Each layer has thermal resistance; temperature falls layer by layer;
- The winding center is hottest = hot-spot temperature; tank-top oil next; ambient lowest.
Key concepts:
- Top oil temperature: tank-top oil temperature — measurable, what operations usually use;
- Hot-spot temperature: the hottest insulation point, which decides life — not directly measurable, only estimable;
- Hot-spot-to-oil difference (ΔH): about 10–20 °C in normal design (depends on load and cooling mode).
Key insight: the hot spot hides inside the winding; a thermometer cannot reach it. Top oil is the proxy; the thermal-circuit model back-calculates the true hot spot from that proxy.
2. Top Oil vs Hot-Spot Rise
The hot spot is not "oil + a fixed offset"; it moves dynamically with load:
Hot-spot ≈ ambient + oil rise + hot-spot-to-oil difference
- Oil rise: top oil minus ambient; grows with the square of load (loss ∝ I²);
- Hot-spot-to-oil difference: grows with load — more load, larger internal winding gradient;
- Thermal time constants: oil ~1–3 hours, winding ~5–10 minutes — after a load step, oil rises slowly (hours) while the hot spot rises fast (minutes).
What this means: a transformer's load spikes at noon; by afternoon the oil has not caught up, but the hot spot may already be over its limit — watching oil misses those hours of hot-spot excursion.
Practical estimation (simplified thermal-circuit model):
- Steady state: hot-spot rise ≈ oil rise × (1 + hot-spot coefficient);
- Transient: hot-spot approaches its new steady state exponentially with the thermal time constant;
- Common model: the simplified thermal circuit of the IEC 60076-7 loading guide — inputs: top oil, load factor, ambient temperature.
Key insight: the hot spot reacts faster and swings wider than the oil. Oil is a slow variable (hours); the hot spot is a fast variable (minutes) — judge uprating and overloads by the hot spot, not the oil.
3. Hot-Spot Lag Under Load Fluctuation
Electrical load fluctuates; hot-spot temperature follows it, but the two are not synchronized:
Where the lag comes from:
- Large oil time constant (1–3 h): oil smooths load swings and changes slowly;
- Small winding time constant (5–10 min): the hot spot tracks load and changes fast;
- Therefore: load changes first, hot spot changes fast, oil changes slow.
Practical effects:
- Short load spikes: the hot spot jumps instantly while the oil barely moves — watching oil misses the hot-spot overshoot;
- Sustained high load: the hot spot rises first; oil catches up later — oil is "after-the-fact confirmation," the hot spot is "real-time risk";
- Load drops: the hot spot falls fast while oil lags — high oil does not mean the hot spot is still high; do not misjudge.
Engineering meaning: whether an overload can be tolerated is judged by whether the hot spot exceeds its limit, not the oil. Hour-by-hour hot-spot computation over the load profile is the only way to see the windows where "oil did not react but the hot spot was already over."
Key insight: the hot spot's real-time nature is exactly why it is more dangerous than oil — and why it must be computed. By the time oil alarms, the hot spot may have been over for hours.
4. Hot-Spot Temperature vs Aging Rate: The 6 °C Rule
The quantitative basis of insulation aging is the classic thermal-aging law:
6 °C rule: every ~6 °C hot-spot rise roughly doubles the paper aging rate. This is an engineering simplification of the Arrhenius chemical-rate relation (activation energy ~105 kJ/mol for insulation paper).
Aging-rate comparison (baseline 1.0 at 98 °C hot spot):
- 92 °C: ~0.5× (life doubles);
- 98 °C: 1.0× (design baseline);
- 104 °C: ~2× (life halves);
- 110 °C: ~4×;
- 116 °C: ~8×.
Cumulative aging equivalent: a transformer runs under fluctuating load, so the hot spot goes up and down. Engineering uses weighted equivalent aging: accumulate each period's actual aging rate over time into "equivalent hours at 98 °C." Per year:
- Cumulative equivalent < 8,760 hours (hours in a year) = life not overdrawn;
- Cumulative equivalent > 8,760 hours = life consumed faster than designed.
Key insight: life is decided by the integral of the temperature-time curve, not the peak temperature. A few hours at 110 °C is survivable; years at 105 °C is deadly — it accumulates.
5. What Data Remaining-Life Estimation Needs
To compute "how many more years," four inputs are required:
1. Full-year load profile (most critical)
- Hourly or 15-minute load current data;
- Without history, at least "typical daily load + seasonal coefficients."
2. Top-oil temperature series
- Online transformer oil-temperature data if available;
- Without measurements, back-calculate from load and ambient with the thermal model.
3. Ambient temperature
- Local meteorological data (monthly/daily averages);
- Summer hot days are the main contributors to accelerated aging — they must be included.
4. Insulation design parameters
- Nameplate hot-spot limit (typically 98 °C, some 105 °C);
- Cooling mode (ONAN/ONAF) temperature-rise parameters.
Estimation flow:
- Compute the hot spot hour by hour (thermal-circuit model);
- Convert to aging rate hour by hour (6 °C rule);
- Integrate over the year for the aging equivalent;
- Compare with the design-life annual equivalent (typically 20–30 years) to get the remaining-life ratio.
Key insight: no load profile, no remaining life. This is data-driven predictive maintenance — FEXLINK's platform provides exactly the hourly current, oil temperature, and ambient-temperature data foundation.
6. Product Landing: Thermal-Circuit Computation in the Predictive Maintenance Solution
FEXLINK's Predictive Maintenance Solution turns the thermal-circuit model into online computation:
- Collects three-phase current, top oil temperature, ambient temperature (sensing layer), stored hourly;
- The platform's built-in thermal-circuit model engine computes the hot spot hour by hour and plots the trend;
- Applies the 6 °C rule to accumulate aging equivalents and outputs "remaining-life estimate" and "annual aging report";
- When the hot spot approaches its limit, the Tianyan engine issues a trend warning to arrange shedding or maintenance early;
- For uprating evaluations, it directly answers "what hot-spot does this load profile produce" with a clear conclusion.
Design principle in one sentence: turn "the old hand's estimate" into "the platform's real-time computation." Remaining life is not a guess; it is an integral of hourly data.
7. Common On-Site Mistakes
- Judging safety by top oil only: 72 °C oil looks "normal," but the hot spot may be 108 °C. Consequence: years of accelerated aging unknown. Correct: compute the hot spot with the thermal model; oil is only a reference.
- Judging life by peak temperature: one day at 110 °C and the transformer is "finished." Consequence: panic or wrong decisions. Correct: watch the full-year aging equivalent; occasional excursions are acceptable, sustained ones are dangerous.
- Ignoring ambient temperature: winter headroom computed, summer hot spot 10 °C+ higher. Consequence: summer overload incidents. Correct: use the full-year ambient curve, especially summer hot days.
- Treating short-term overload as continuous: derate or replace after 30 minutes at 120% load. Consequence: wasted capacity, wrong investment. Correct: evaluate short-term overload capability by the winding time constant (the hot spot falls within minutes).
- Concluding without load data: estimating "10 more years" without knowing the load profile. Consequence: unsupported conclusions. Correct: collect at least a typical daily load profile before discussing remaining life.
Scope and Limitations
This article discusses thermal-circuit modeling and remaining-life estimation for oil-immersed transformers, applicable to 10 kV–220 kV oil-immersed power transformers. Hot-spot limits and temperature-rise parameters follow the nameplate and IEC 60076-7 loading guide. Dry-type transformers have different thermal behavior and need adjusted methods. Hot-spot estimation depends on the completeness and accuracy of load, oil, and ambient data. All cases are anonymized (a certain chemical plant / data center) and do not refer to any specific customer.