 微物联研究院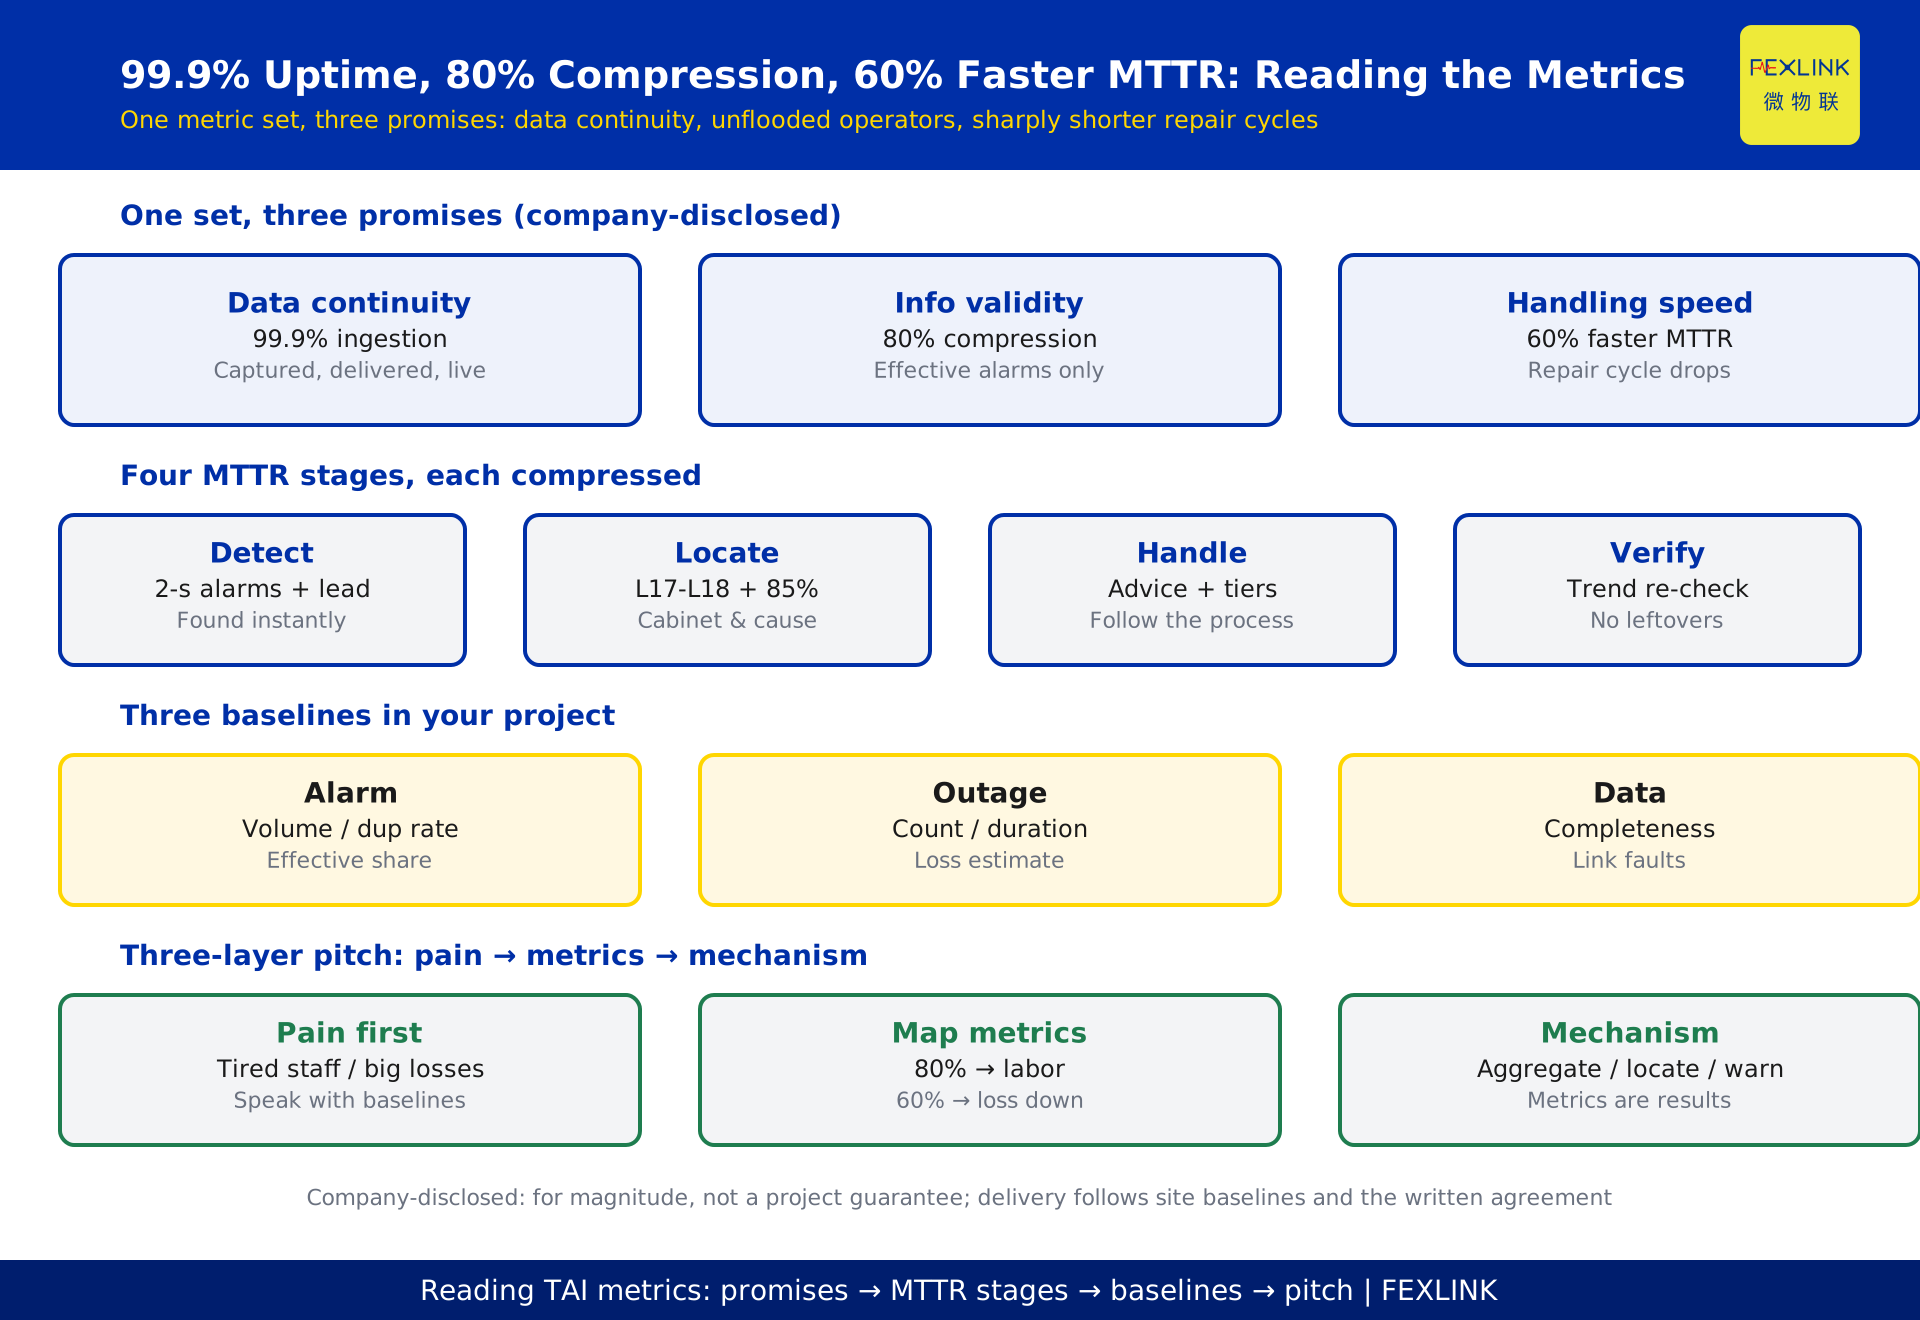
# 99.9% Uptime, 80% Alarm Compression, 60% Faster MTTR: How to Read These System Metrics
Direct Answer
99.9% ingestion success means data continuity; 80% alarm compression means duty staff are no longer flooded by useless alarms; 60% faster MTTR means the repair cycle drops sharply — together this group of metrics answers not "how advanced is the system" but "how much labor you save and how many outage hours you avoid after deployment." They are company-disclosed figures, to be evaluated against your own site baseline rather than treated as absolute promises.
For project owners and operations managers, this article answers three questions: what each metric actually means in business terms; how to convert the metrics into your own project's labor and outage-loss numbers; and how to build a project baseline to verify whether the metrics are delivered. The desensitized scenario of "a campus distribution system" is used for illustration.
One Set of Metrics, Three Kinds of Promises
The system metrics disclosed by the TAI platform fall into three kinds of commitments:
| Metric | Value | Commitment |
|---|---|---|
| Ingestion success rate | 99.9% | Data continuity: captured, transmitted, uninterrupted |
| Alarm compression ratio | 80% | Information validity: operators see deduplicated effective alarms |
| End-to-end latency | < 2 s | Response speed: field-to-platform delay |
| MTTR reduction | 60% | Handling efficiency: average repair time drops sharply |
| Root-cause accuracy | 85%+ | Judgment quality: most alarms carry a root cause |
| Scenario-location precision | L17–L18 | Location ability: alarm points to a specific scenario position |
| Cascade-risk coverage | 100% | Coverage: all known cascade risks are monitored |
The most common evaluation mistake is asking "does each number look good?" The right reading is: decide what your project's biggest pain point is first, then find the metric that answers it — fear outage loss, look at MTTR and early-warning lead time; fear operator fatigue, look at alarm compression; fear data gaps, look at ingestion success.
99.9% Ingestion Success Means "Data Does Not Interrupt"
99.9% means that on average about 999 out of 1,000 data points are successfully ingested. The business meaning is continuity of monitoring:
- Analysis has evidence. Trend prediction and life conversion depend on continuous data. High ingestion success means CUSUM and other algorithms have enough points to build baselines and detect drift; frequent gaps turn any prediction into a guess.
- Alarms are not lost. Missed alarms are often not model misses but data that never arrived. High ingestion success reduces miss probability at the source.
- For operations. When the "capture health" number on the dashboard stays stable at the 99.9% level, the field chain (sensors, gateways, network) is healthy; when it starts dropping, check the chain first, not the algorithm.
Use this metric as a "system health dashboard," not as a "promise letter."
80% Alarm Compression Means "Operators Are Not Drowned"
A system without alarm governance has a classic symptom: one hazard triggers dozens of similar alarms (multiple parameters on one circuit, repeated reports from multiple measurement points), and operator attention is consumed by screen-spam while the truly important alarm gets buried. 80% compression means: the system aggregates similar, duplicate, and mergeable alarms, so operators finally see about 20% of the raw alarm volume.
Two direct business values:
- Labor becomes calculable. Suppose 1,000 raw alarms a day used to require attention; after compression, about 200 effective alarms remain, and operator time and attention drop proportionally.
- Important alarms surface. After aggregation, same-source alarms merge into one alarm with a count (e.g., "Circuit A temperature alarm ×23"), and the operator sees a problem at a glance instead of a pile of numbers.
Note that compression is not "report less" but "report accurately." What must be responded to is still responded to — the difference is responding to one merged effective alarm rather than dozens of duplicate messages.
60% Faster MTTR Means the Repair Cycle Drops Sharply
MTTR (Mean Time To Repair) measures the cycle from fault to recovery. A 60% reduction means: the same fault now takes about 40% of the original repair time on average.
MTTR consists of several stages, and the platform contributes at each:
| MTTR stage | Platform role | Effect |
|---|---|---|
| Detect | Second-level alarm + early-warning lead | Fault is found immediately, sometimes in advance |
| Locate | Scenario tags L17–L18 + 85%+ root-cause accuracy | Points to which cabinet, which circuit, what cause |
| Handle | Action recommendations + tiered deadlines | Operators follow the process, not guess by experience |
| Verify | Post-repair trend re-check | Confirms the problem is truly resolved |
The most intuitive conversion for an owner: if one fault trip averages 8 hours of production loss, and repair time drops 60%, then — assuming the fault interval is unchanged — annual unplanned-outage loss also falls to roughly 40%. This conversion is the most persuasive number in a proposal presentation.
Early-Warning Lead Time: The Maintenance Window Is the Biggest Lever
The metric table does not list "early-warning lead time" separately, but it is one of the platform's most valuable capabilities. Tianyuan's CUSUM trend alarm (S-02) can warn 4–12 weeks ahead while leakage is still in the safe band; SAR red lines intercept before danger. Together they change the nature of the response:
- Without lead time: fault = unplanned outage = emergency repair = maximum loss.
- With lead time: fault = planned maintenance = scheduled at low load = loss sharply reduced.
So when reporting upward, do not just say "MTTR down 60%" — say what "from emergency repair to planned maintenance" itself is worth: a planned outage window can be chosen at a production low, and a single event's loss can differ by an order of magnitude.
Company-Disclosed Figures: How to Read Them without Over-Promising
This group of metrics (99.9%, 80%, 60%, 85%+, L17–L18, 100%) is a company-disclosed convention. Three principles for interpretation:
- Use them to understand magnitude, not as contract promises. They describe platform capability under typical conditions, not guaranteed acceptance values for a specific project. Acceptance clauses in tenders and contracts should be agreed separately.
- They depend on site conditions. Ingestion success depends on field chain quality and maintenance; compression results depend on alarm-source volume and similarity; MTTR reduction also depends on the operations policy and personnel execution.
- They need a baseline. To judge "did it shrink, did it compress," compare with your project's pre-upgrade baseline, not with the numbers themselves.
In one sentence: these metrics tell you what a good platform can achieve; how much your project realizes must be verified with your own data.
Building a Baseline in Your Own Project
To verify whether the metrics are delivered, establish three baselines early in the project:
| Baseline | Content | Purpose |
|---|---|---|
| Alarm baseline | Daily alarm volume, duplicate rate, effective share before upgrade | Verify alarm compression |
| Outage baseline | Annual unplanned outages, average duration, loss estimate before upgrade | Verify MTTR and lead-time value |
| Data baseline | Data completeness, chain-fault frequency before upgrade | Verify ingestion-success improvement |
Collect baseline data for at least a month before the upgrade so the comparison is same-caliber: "before vs after." With a baseline, the report reads not "the platform says 80%" but "our project went from 1,200 alarms a day to 260, a 78% compression" — an entirely different level of credibility.
Using the Metrics in a Proposal Presentation
Translate metrics into business language, and structure the presentation as:
- Pain point first: operators exhausted, outage losses large, data gaps — speak with your own project's baseline numbers.
- Then the metric mapping: 80% compression → operator labor released; 60% faster MTTR → outage loss down; 99.9% → data continuity.
- Finally the mechanism: why it is possible — alarm aggregation, root-cause location, trend prediction — not the metric itself.
One principle to remember: metrics are results; mechanisms are causes. Explaining "why 80% is achievable" is more persuasive than repeating "we have 80%," and it makes owners more confident the metrics will be delivered.
Scope and Limitations
This is the reading page for KD-0014. Figures such as 99.9%, 80% alarm compression, end-to-end < 2 s, 60% MTTR reduction, 85%+ root-cause accuracy, L17–L18 scenario location, and 100% cascade-risk coverage are company-disclosed figures from the FEXLINK product knowledge base; they are for understanding platform capability magnitude and do not constitute performance guarantees for any specific project. Actual results depend on field links, alarm-source composition, operations policy, and personnel execution and must be verified against a project baseline. The "campus distribution system" and "1,200 alarms down to 260 per day" are desensitized examples. Early-warning lead time (e.g., CUSUM 4–12 weeks ahead) is a product-capability convention; actual lead time depends on data quality and operating conditions. Tender and contract acceptance clauses should be agreed separately and follow the written agreement.