 微物联研究院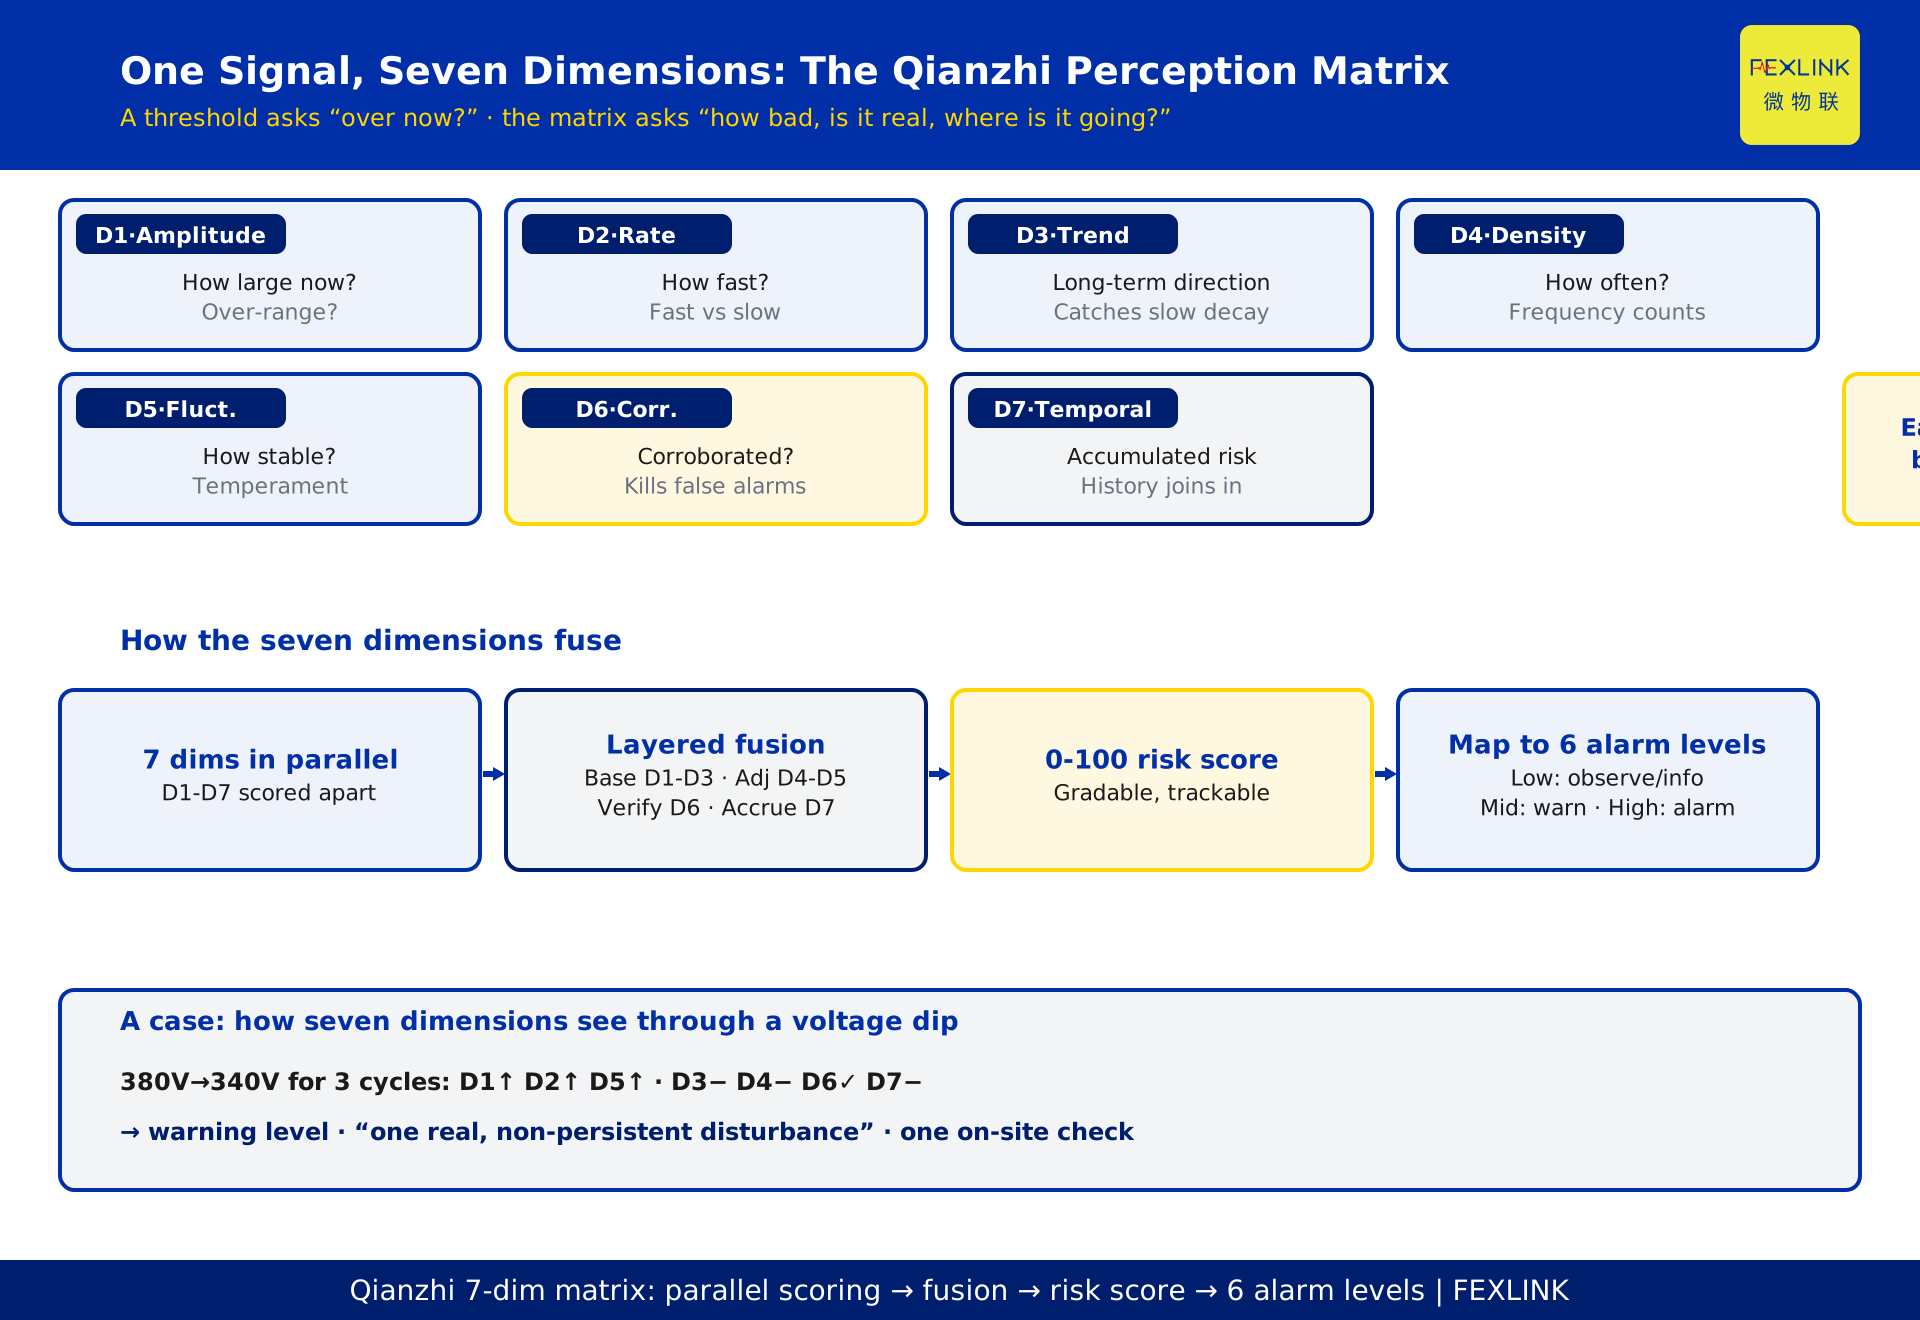
Direct Answer
The Qianzhi engine does not judge an electrical signal by "whether a value exceeded a threshold." It scores the signal along seven dimensions at once and fuses them into a continuous 0–100 risk score: D1 amplitude, D2 rate of change, D3 trend drift, D4 anomaly density, D5 fluctuation, D6 correlation verification, D7 temporal risk. In one sentence: a single threshold asks "has it exceeded now?", while the seven-dimension matrix asks "how severe is it now, is it real, and where is it heading?" Each dimension is scored independently by its own sub-model, then combined by rules and mapped to six alarm levels. That is what separates "perception" from "measurement."
1. Why Single-Threshold Alarms Are Not Enough
The most common approach in conventional electrical monitoring is a threshold: alarm at 65 °C, alarm at 1000 A. It is simple, but it has two built-in flaws.
First, missed alarms. Hazards develop slowly. An SPD leakage current creeping from 200 µA to 800 µA already shows a clear trend, yet as long as the threshold is not touched, the system stays silent — and by the time the threshold is crossed, the fault is often near. A threshold alarm can only ever tell you "it is already too late."
Second, false alarms. A single load switching event or a voltage dip can push a value past the threshold for an instant, yet it is a normal disturbance, not a hazard. A single threshold cannot tell "real excursion" from "apparent excursion," so alarms flood and operators eventually go numb.
Missed and false alarms are two sides of the same coin: a loose threshold misses, a tight threshold false-alarms. The flaw is amplified in electrical-safety scenarios because electrical hazards typically "come slowly and hide deep": contact-resistance degradation develops over weeks or months, insulation aging over years, and by the time values exceed the threshold, the actionable window is often narrow. The only way to suppress both missed and false alarms is to stop looking at single points and look at combined evidence across multiple dimensions.
2. The Seven-Dimension Matrix at a Glance
The seven dimensions are not seven "higher thresholds" in parallel; they characterize the same signal from seven different angles:
| Dim | Name | Question it answers |
|---|---|---|
| D1 | Amplitude | How large is the signal now? Over-range? |
| D2 | Rate of change | How fast is it changing? |
| D3 | Trend drift | Which way is the long-term baseline moving? |
| D4 | Anomaly density | How many anomalies per unit time? |
| D5 | Fluctuation | How unstable is the signal? |
| D6 | Correlation | Do other points/quantities corroborate it? |
| D7 | Temporal risk | How much risk has accumulated over time? |
Each dimension is scored by an independent sub-model with no mutual interference; only the seven scores together give a complete description of the signal's current state and trend.
3. D1–D3: Amplitude, Rate of Change, and Trend Drift
D1 amplitude is the most basic dimension, close to conventional threshold judgment — but the output is not "over/not over"; it is a continuous 0–100 score: the farther from rated, the more over-range, the higher the score. It preserves the sensitivity of traditional alarms.
D2 rate of change answers "how fast." Two signals with the same normal amplitude at a given moment — one climbs 5% in ten minutes, the other 50% — are very different: the former may be a load swing, the latter more likely contact-resistance degradation. The rate dimension separates "fast" from "slow."
D3 trend drift answers "where is it heading long-term." It builds a trend judgment on a time baseline: stable, slowly rising, clearly drifting up, accelerating drift — each mapped to a different risk band. Trend drift is the key to catching "slow hazards": an SPD leakage rise of a few hundred microamps is unremarkable in amplitude alone, but once the trend drifts, the early risk surfaces. One caveat: trend judgment needs a stable baseline. If the baseline itself is drifting (e.g., air-conditioning load raising the summer current baseline across an entire campus), the algorithm must normalize for season and load first, or it will mistake normal load change for degradation. That is also why the trend dimension must be cross-validated with amplitude and density: baseline shifts tend to be site-wide and synchronized, whereas degradation usually appears at individual points.
4. D4–D5: Anomaly Density and Fluctuation
D4 anomaly density counts how often anomalies occur per unit time. A single excursion may be a disturbance; repeated excursions in a short window, even if each is mild, may indicate a worsening state. The density dimension brings "frequency" into the judgment.
D5 fluctuation characterizes stability. A steady voltage waveform and a violently fluctuating one reflect completely different physical states — harmonic pollution, equipment resonance, or power-quality deterioration all show up as increased fluctuation. The fluctuation dimension makes "is it stable?" an independent risk signal.
D4 and D5 have a special value: they do not depend on any single threshold; they characterize the signal's overall "temperament." Equipment degradation typically first shows up as a "worse temper" (more frequent, more jittery) and only later as "value exceeded."
5. D6–D7: Correlation Verification and Temporal Risk
D6 correlation verification places "this signal" inside "the whole system." A high reading at one point could be a sensor issue or genuine overheating; but if the adjacent terminal's temperature rises in step, the loop current rises, and harmonics worsen simultaneously — multiple signals corroborating each other change the confidence completely. Correlation verification is the strongest lever against false alarms.
D7 temporal risk answers "how much has risk accumulated over time." It weights D1–D6 results over time: a single mild excursion scores low, but if it recurs with shrinking intervals, the temporal score accumulates. The temporal dimension lets "history" participate in the current judgment. Note that temporal scoring needs a certain history of data: for a newly connected site with insufficient data, the dimension participates at conservative defaults and gradually releases authority as data accumulates — which is also why new sites tend to alarm conservatively at first.
6. Fusing the Seven Dimensions: From a 0–100 Score to Six Alarm Levels
The fusion is not a simple average; it is layered:
- Base score: D1/D2/D3 decide current severity;
- Adjustments: D4/D5 modulate "persistence" and "stability";
- Verification: D6 raises confidence when corroborated, lowers it when not;
- Accumulation: D7 adds the time factor.
The result is a continuous 0–100 risk score. From an engineering standpoint, seven sub-models scoring in parallel with configurable fusion weights brings two practical benefits: first, different scenarios can emphasize different dimensions — data centers weight temperature trends, distribution rooms weight current harmonics, lightning protection weights leakage-current drift; second, operators can adjust the weight of one dimension based on field feedback without retraining the whole engine. 0 means fully normal; 100 means act now. The score maps to six alarm levels: low bands to observation/info levels, middle bands to warning/advisory levels, high bands to alarm/emergency levels. Compared with the 0/1 output of a threshold, a continuous risk score is gradable, sortable, and trackable — operators see whether risk is "rising" or "falling," rather than waiting for a single alarm.
7. An Example: How Seven Dimensions "See Through" a Voltage Dip
A voltage dip occurs on a workshop feeder: amplitude drops from 380 V to 340 V for three cycles. How does a single threshold judge it? Set at 360 V, it is an excursion — alarm. Set at 340 V, it does not alarm. Both settings are wrong.
The seven dimensions: D1 amplitude drops clearly (high), D2 rate is high, D5 fluctuation rises — but D3 trend drift is insignificant (the baseline before and after the dip is unchanged), D4 density is low (a single event), D6 correlation finds the feeder current rising in step and the busbar voltage dipping simultaneously (multiple paths corroborate a real event), and D7 temporal risk does not accumulate (no recurrence).
The fusion: this is a real, single, non-progressive event — a medium-high risk score, producing a warning-level alarm with an event description rather than an emergency flood. Operators do one on-site check and move on, unbothered by "false emergencies." The example also shows that the seven dimensions' value lies not in "being more sensitive" but in "being more accurate": for the same dip, a threshold either misses or floods, while the matrix returns an accurate description — "one real but non-persistent disturbance" — losing neither detection nor calm.
8. Engineering Value and Boundaries
The engineering value of the seven-dimension matrix comes down to three points:
First, fewer alarms. Correlation verification and density judgment keep masses of single-point disturbances out of the queue, compressing alarms to what is truly worth attention.
Second, early risk becomes visible. Trend drift and temporal accumulation expose "not yet over limit but already degrading," moving the handling window earlier.
Third, explainability. Every risk score can be decomposed back into the seven dimensions: why 72? D3 trend drifting up + D4 density rising + D7 accumulating — a complete evidence chain, so operators know what to trust and what to check.
Boundaries should be stated clearly: the matrix is a perception-layer judgment capability. Its input is field data quality — a broken sensor, missing data, or unsynchronized sampling distorts any dimension; and its output is a risk indication, not a fault-location conclusion. On-site handling still requires equipment context and human review.
Scope and Limitations
The seven-dimension perception matrix discussed here applies to understanding the Qianzhi engine's risk-scoring mechanism. The "0–100 risk score" and "six-level alarm mapping" are platform design conventions; specific mapping rules and sub-model parameters follow product documentation. Seven-dimension judgment depends on edge data quality and synchronized sampling, so the acquisition chain must be intact in field deployment. The voltage-dip example is an illustrative desensitized scenario and does not represent any specific project's data. The matrix does not replace on-site maintenance procedures; high-level alarms still require human review and handling.