 微物联研究院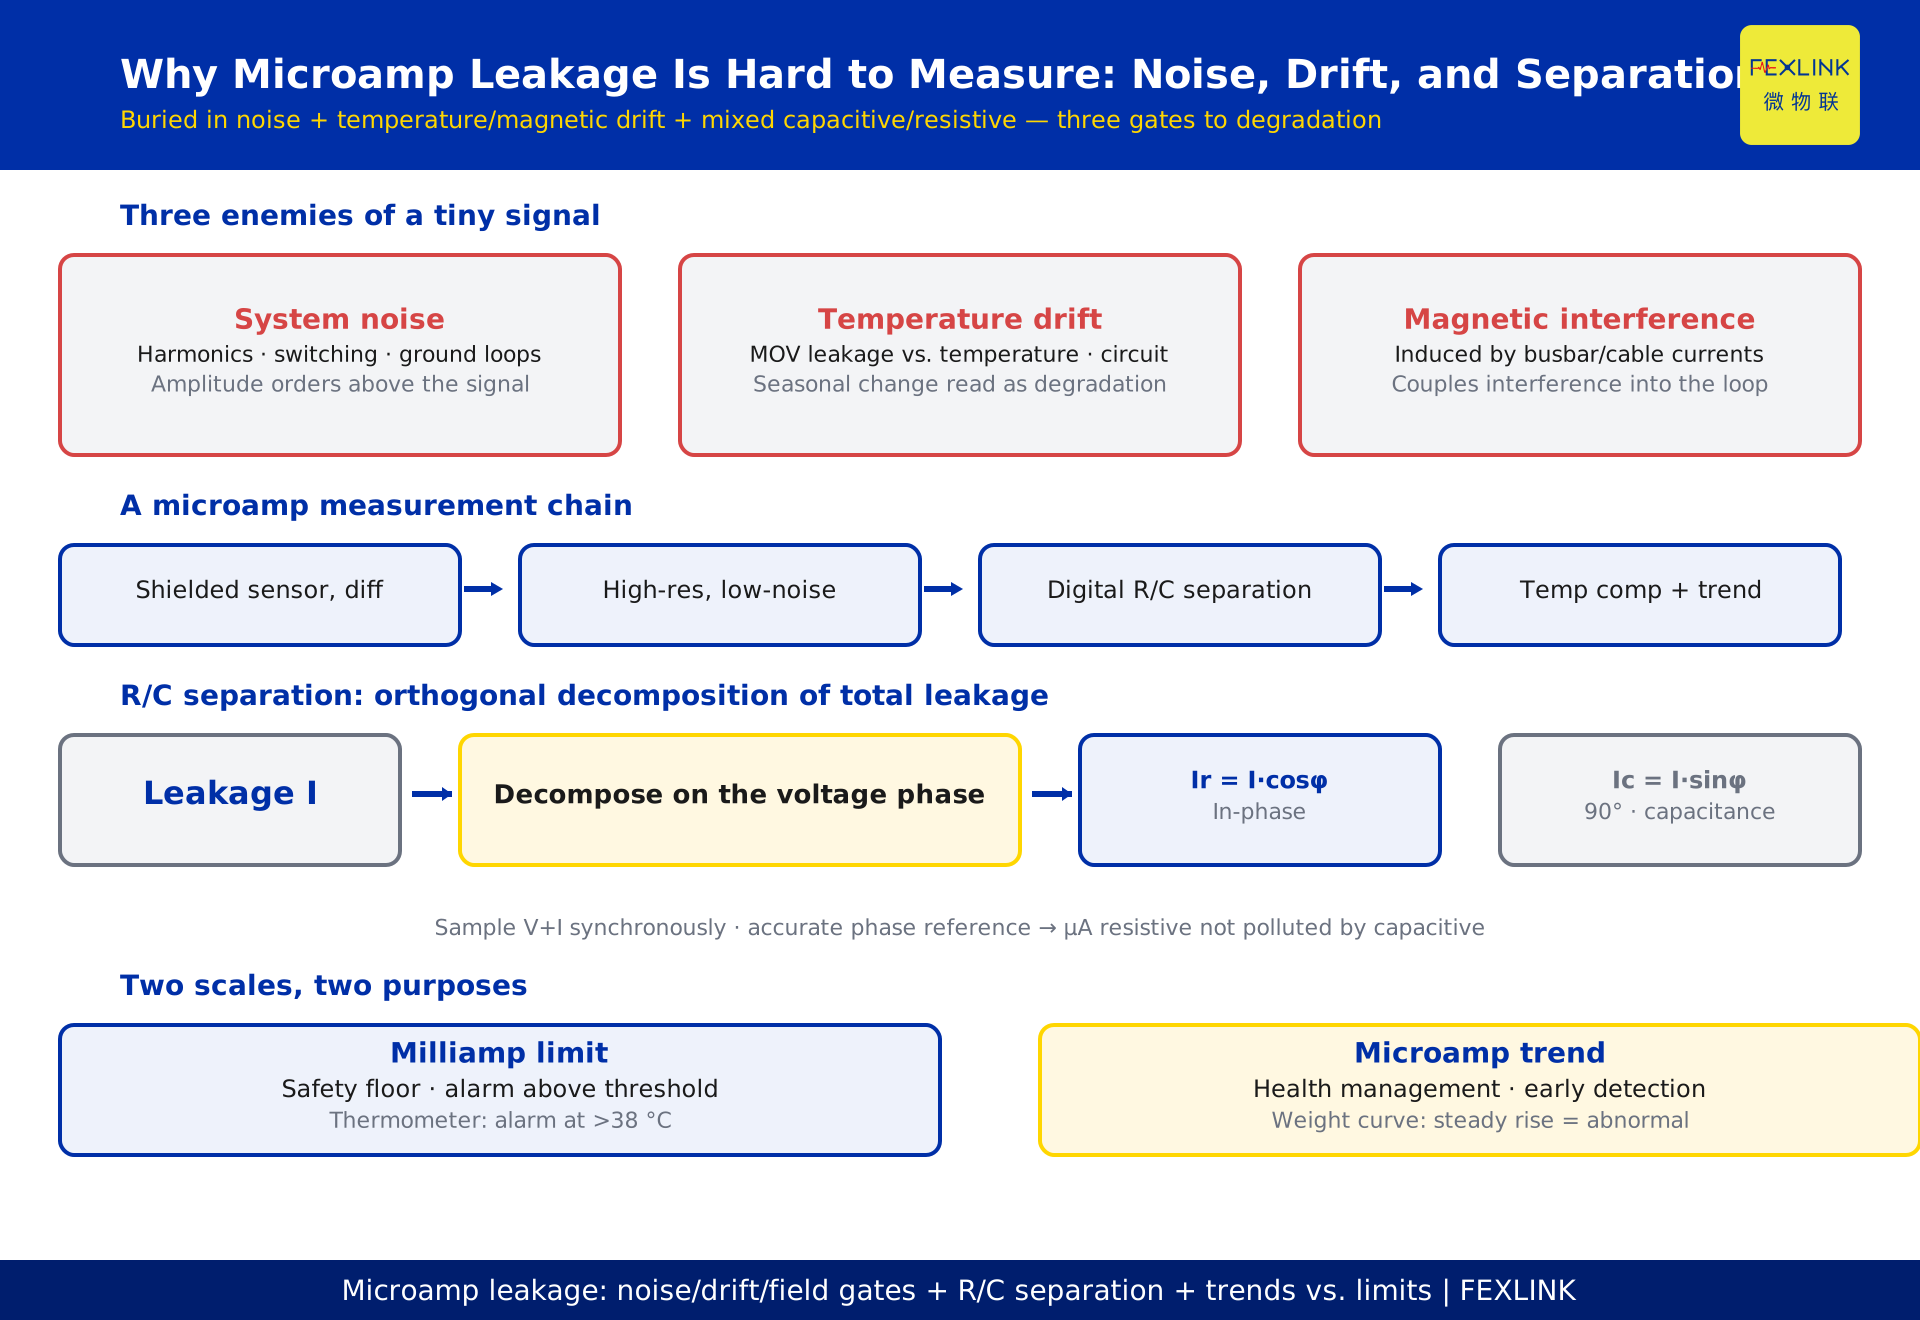
Direct Answer
The earliest signal of SPD degradation and insulation aging is usually not "current going up" but a slow drift of leakage current at the level of tens of microamps — several orders of magnitude smaller than the current of an ordinary household LED. Why is such a small signal hard to measure? Because three battles must be won at once: pull the small signal out of the noise, keep temperature drift and magnetic interference out, and separate capacitive leakage from resistive leakage. Only a combination of high-resolution sampling, shielding, and a resistance/capacitance separation algorithm can lift the early SPD degradation trend out of the noise floor. In one sentence: a device that can watch microamp trends earns that ability not from an impressive resolution spec, but from the system-level capability of its whole signal chain — shielding, sampling, and algorithm together.
1. Why SPD Degradation Appears at the Microamp Level
The core component of an SPD is the metal-oxide varistor (MOV). Its aging mechanism: after repeated lightning and switching-surge stress, the internal grain-boundary structure gradually degrades and leakage current creeps upward. In the early stage, that rise is typically only tens to hundreds of microamps — far too small to trigger any "limit exceeded" decision, yet it is the earliest indicator that the SPD is heading toward failure.
Similarly, electrical insulation aging (falling insulation resistance, moisture ingress) also appears early as a microamp-level drift of leakage current. These signals share two traits: they change slowly (over days or weeks) and they are tiny (microamps). They are not suited to "instantaneous limit" detection but to trend tracking — which means the measurement system must be stable and sensitive rather than merely "fast."
2. Three Enemies of a Small Signal: Noise, Temperature Drift, Magnetic Interference
The first hurdle for microamp measurement is the environment. Three interference sources are almost everywhere:
First, system noise. The grid is full of harmonics, switching noise, and ground-loop noise whose amplitude can exceed the microamp signal by orders of magnitude. Without adequate signal-to-noise ratio, the signal drowns in the noise floor.
Second, temperature drift. Leakage current changes with temperature — varistor leakage is temperature-sensitive, and the amplifier and reference in the measurement circuit drift too. If a device does not distinguish "drift caused by temperature" from "drift caused by degradation," it will mistake normal summer changes for degradation, or miss winter degradation entirely.
Third, magnetic interference. SPD branches often sit near busbars and cables carrying large currents; their magnetic fields induce interference voltages in the measurement loop. This interference couples into the same sensor as the signal and must be suppressed at the structure and wiring level.
3. Capacitive vs. Resistive Leakage: Why They Must Be Separated
An SPD's leakage current is not "one number"; it has two components:
- Capacitive leakage current: produced by the line-to-earth distributed capacitance, proportional to voltage and leading it by 90°, reflecting "how much line capacitance exists";
- Resistive leakage current: produced by insulation resistance and varistor grain-boundary conductance, in phase with voltage, reflecting "whether insulation and components are degrading."
The problem: the capacitive component is usually much larger than the resistive one. If total leakage is measured directly, normal fluctuations of the capacitive part (e.g., voltage swings) mask changes in the resistive part — yet it is precisely the resistive component that characterizes degradation. That is why "measuring leakage current" is not the same as "seeing degradation."
4. The Separation Principle: Phase-Based Orthogonal Decomposition
The core method for extracting the resistive component from total leakage is phase-based orthogonal decomposition:
Using the voltage phase as the reference, decompose total leakage current into two orthogonal components — the in-phase component is resistive leakage; the quadrature (90°-shifted) component is capacitive leakage. In engineering practice, voltage and current waveforms are sampled synchronously and the projection is computed in the digital domain:
Ir = I·cosφ (resistive) / Ic = I·sinφ (capacitive)
where φ is the phase angle of the current relative to the voltage. This looks like pure math, but the prerequisites are: voltage and current must be sampled synchronously, and the phase reference must be accurate. Even a few degrees of phase error lets the capacitive component pollute the microamp-level resistive component. Mature monitoring units therefore acquire voltage and leakage current together, not current alone.
5. How Sampling Resolution and Shielding Work Together
With the algorithm in place, hardware must deliver the signal "in and accurate":
- High-resolution sampling: microamp signals require an ADC with enough effective bits and low noise; channel resolution decides whether the signal can be quantized at all;
- Shielding and differential input: the sensor and signal lines are shielded, and differential input rejects common-mode interference, keeping magnetic and ground-loop noise out of the chain;
- Low-drift reference and temperature compensation: software compensation or thermal design removes "temperature-driven change" from "degradation-driven change";
- Long-term stability: trend monitoring is a marathon; the chain must keep drift under control for months and years, or the device's own drift contaminates the trend.
Sampling resolution and shielding are the "see it" prerequisites; resistance/capacitance separation is the "see it accurately" prerequisite. All four are required.
In a typical configuration: to resolve a 1 μA change on a 10 μA signal, the ADC's effective bits and noise floor must match — a 16-bit ADC with a low-noise front end is common. But what really sets the floor is front-end noise, shielding integrity, and reference drift, not the bit count alone. A high-bit device with poor shielding will have its effective resolution dragged down by noise by orders of magnitude.
6. Microamp Trends vs. Milliampere Limits: Different Purposes
Both measure "leakage," but the two scales answer different questions:
| Scale | Typical magnitude | Questions it answers | Limitation |
|---|---|---|---|
| Milliampere limit | mA | Is leakage above the safety threshold? | Degradation is often mid-to-late by the time it trips |
| Microamp trend | μA | Is degradation continuing, and how fast? | Needs a stable baseline; instantaneous values are not enough |
Milliampere limits serve as the "safety floor" — above the threshold, alarm or prompt maintenance. Microamp trends serve as "health management" — detect direction and rate early, schedule planned maintenance. A complete SPD monitoring scheme needs both: trends find early risk; limits backstop safety.
A useful analogy: the milliampere limit is a thermometer that alarms above 38 °C; the microamp trend is a weight curve — weigh daily, and several consecutive weeks of steady rise say something is wrong. Degradation is a slow variable, inherently suited to trends rather than thresholds. This is why, on the same branch, one device can only report "leakage over limit" while another can show "slope sharply increasing from week 9." The value of trend monitoring is not single-reading accuracy but the direction and rate of change once the baseline is stable.
7. Engineering Deployment: The SPD Monitoring Chain
Bringing the principle down to a concrete monitoring chain:
SPD-branch leakage sensor (shielded, differential) → voltage reference sampling → high-resolution ADC → digital resistance/capacitance separation → temperature compensation → trend modeling and alarming → upload to the intelligent lightning-protection online monitoring platform
FEXLINK's intelligent lightning-protection online monitoring system is organized along this chain: the FS/ESM SPD monitor acquires branch leakage current and performs resistance/capacitance separation; the FSS intelligent surge protective device embeds monitoring capability; data flows into the platform for trend analysis and record management. One practical rule from the field: build a stable microamp baseline for every SPD branch before talking about trend alarms — without a baseline, "change" means nothing.
8. A Quick Judgment Method for Maintenance Teams
Faced with "can this device see SPD degradation trends?", maintenance staff can decide with four questions:
- What does it measure: "total leakage" or "resistive leakage"? A device that only reports total current will rarely see real degradation;
- Synchronization: does it acquire voltage for a phase reference? Without it, resistance/capacitance separation is impossible;
- Stabilization: does it compensate temperature and shield? Without compensation, seasonal temperature will "steer" the trend;
- Output form: "limit alarm" or "trend curve + graded alarms"? The trend curve is the vehicle for early detection.
In one example, a data center's lightning-protection retrofit added microamp monitoring to 40 SPD branches. In week 9, the system found one branch's resistive leakage rising steadily with a clearly steepening slope, while total leakage remained far below the threshold. Replacement was scheduled from the trend prompt; teardown confirmed the MOV had premonitory signs of thermal breakdown. Under milliampere-only monitoring, that SPD would likely have been discovered mid-storm season as a full "group failure."
Going further, the trend slope itself can be graded: a flat rise is "observe," a sharply steepening slope is "plan maintenance," and approaching the threshold is "replace soon." Putting slope into alarms upgrades operations from "is this SPD OK?" to "how long will this SPD last?" — precisely the value that distinguishes microamp trend monitoring from ordinary limit alarms.
Scope and Limitations
The microamp leakage measurement principles discussed here (noise/drift/magnetic interference, resistance/capacitance separation, trends vs. limits) apply to selection and technical judgment for SPD and insulation health monitoring; specific resolution, accuracy, and drift figures are subject to product documentation. "Microamp trend" refers to the ability to track degradation direction given a stable baseline; actual results depend on on-site interference and the time needed to establish the baseline. Separation accuracy relies on synchronous voltage-current sampling quality. The "data center lightning-protection retrofit" case is a desensitized example and does not refer to any specific customer.