 微物联研究院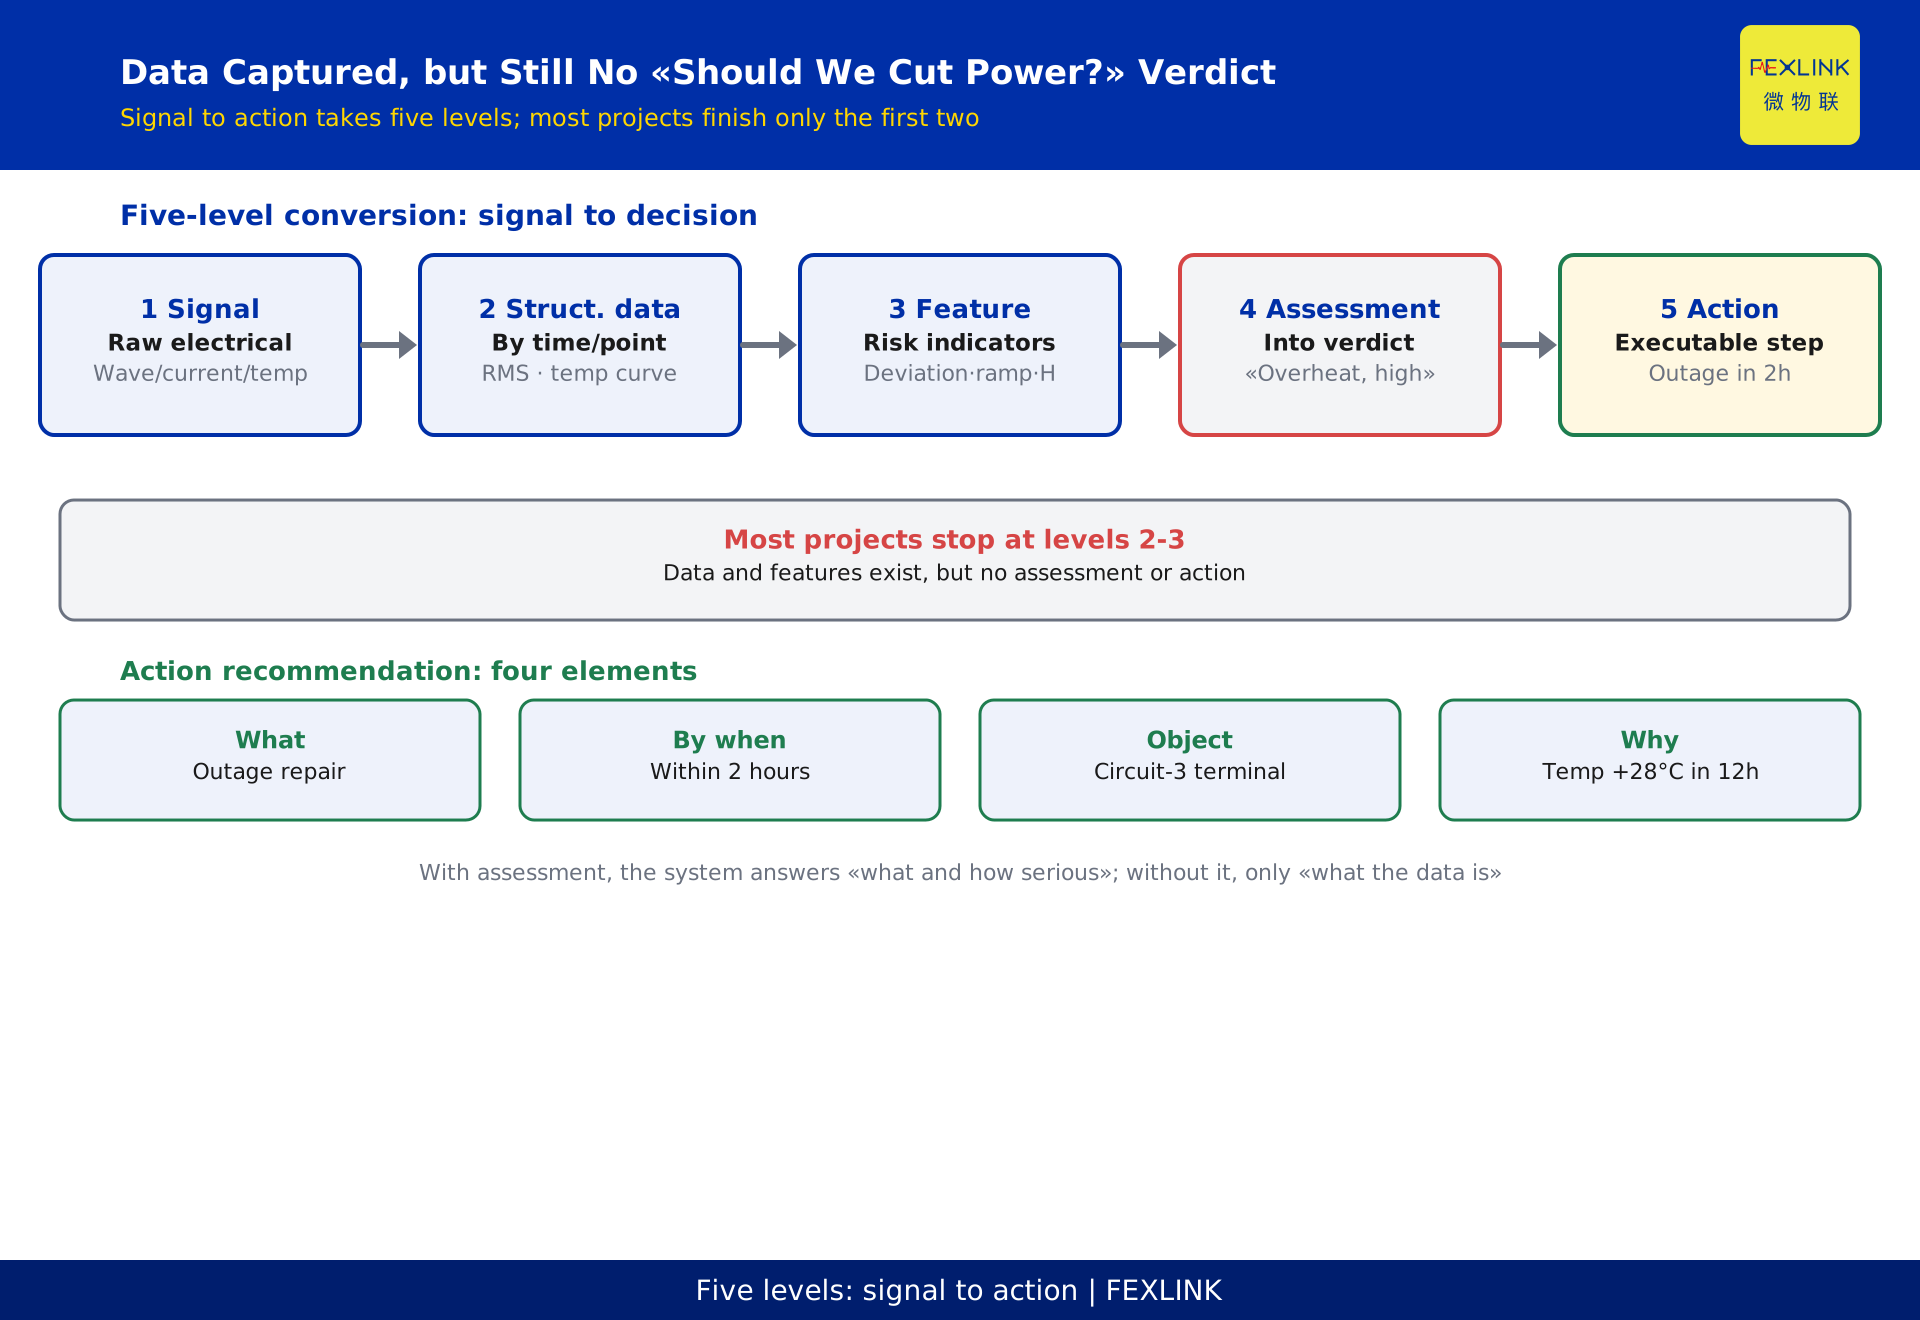
# Data Is Captured, but Still No "Should We Cut Power?" Verdict
Direct Answer
Going from "signal" to "action recommendation" requires five levels of conversion — signal, structured data, feature, risk assessment, action recommendation; most projects complete only the first two, so "lots of data, no verdict." The key to filling the last three levels is building the assessment logic and action recommendations into the system, not just putting data on a screen.
For project owners, operations leads, and teams that have completed data-capture construction, this article explains where each of the five levels breaks, how to fix it, and what an "action recommendation" should actually look like.
The Five-Level Conversion: From Signal to Decision
- Signal: raw electrical quantities output by sensors (voltage waveform, instantaneous current, temperature value);
- Structured data: data organized by time/point (RMS voltage series, temperature curve);
- Feature: risk signals extracted from data (voltage deviation rate, temperature ramp rate, harmonic content);
- Risk assessment: combining features into a judgment ("this circuit has an overheating hazard, high level");
- Action recommendation: giving an executable action ("arrange an outage repair and replace the terminals within 2 hours").
Most projects stop at levels 2-3: data and features exist, but no assessment and no action.
Where Each Level Breaks
| Level | What "broken" looks like | What is missing |
|---|---|---|
| Signal→data | Data intermittent, unsynchronized | Gateway and data governance |
| Data→feature | Raw curves only, no indicators | Feature computation rules |
| Feature→assessment | Single-threshold guesswork, many false alarms | Multi-dimensional assessment model |
| Assessment→action | Alarm issued, nobody knows what to do | Action recommendation and linkage |
Each of the four segments breaks differently; fixes differ too.
Why "Assessment" Is the Watershed
With assessment, the system answers "what happened and how serious"; without it, the system only answers "what the data is."
Judging "should we cut power" requires combining multiple features: a high temperature alone is not necessarily dangerous; sustained rise plus high current plus harmonic anomalies is the combined signal that says "act." That is multi-dimensional assessment — a single threshold can never do it.
What an "Action Recommendation" Should Look Like
A good action recommendation has at least four elements:
- What to do: e.g., "outage repair," "intensify monitoring," "arrange inspection";
- Deadline: e.g., "within 2 hours," "within this week";
- Object: e.g., "terminal block on circuit 3";
- Reason: e.g., "temperature rose 28°C over 12 hours, over threshold and sustained."
An alarm without a deadline and an object is not an action recommendation — it is noise.
How the Taiyi Control Hub Fills the Last Three Levels
FEXLINK's Taiyi control hub turns feature computation, risk assessment, and action recommendations into a systematic chain: the Qianzhi engine performs multi-dimensional assessment (7-dimension perception matrix, 238-dimension electrical parameter evaluation), the Tianyan engine predicts trends, and assessment results output action recommendations with deadline, object, and reason by severity, linked to work orders and responsible staff. Its role is to make the last three levels of "data to decision" real, not just data display.
Self-Check: Which Level Is Your System At
- Can only view curves → level 2;
- Has indicator alarms → level 3;
- Alarms say "serious/general" → level 4;
- Alarms directly give "what, by when, which object, why" → level 5.
Know which level you are at, and you know what the next level is missing.
Seven: How to Land the Assessment Model
From data to conclusion, the assessment layer cannot rely on human judgment alone; land it as a three-piece set:
- Rule base: write common hazards as deterministic rules — leakage above threshold sustained for N minutes triggers an alarm — configurable and traceable;
- Threshold matrix: group thresholds by circuit type, season, and load level, so the same circuit uses different baselines under different conditions instead of one-size-fits-all;
- Scenario library: distill typical scenarios — starting inrush, harmonics, post-strike — into assessment templates that new points reuse directly, avoiding per-point tuning from scratch.
With the three pieces in place, "assessment" moves from individual experience to organizational capability.
How Action Suggestions Enter the Work-Order Flow
An assessment result closes the loop only when it becomes "who, when, what to do":
- Grade the suggestion: three levels — handle immediately (outage/fire risk), handle within a deadline (7 days), and observe/track (into the weekly report);
- Auto-dispatch: level-one suggestions generate work orders automatically and assign owners; level-two enters the to-do list; level-three aggregates into the weekly report;
- Write back results: after a work order closes, write back the outcome — confirmed, false alarm, or rectified — and the write-back data in turn tunes the assessment model.
A work order is not the end of assessment; it is the entry to the assessment loop.
Nine: Common Questions — How to Tune the Model After Go-Live
- How often? weekly review for the first month, monthly or quarterly once stable; review immediately when major conditions change — line retrofit, load adjustment;
- If false alarms rise, what to tune first? threshold matrix (baseline) first, then the rule base (conditions), and model weights last — tuning from deterministic rules toward the model keeps the chain stable;
- Who tunes? platform-side configuration by professional implementers; on-site judgment criteria (scenarios, conditions) requested by duty and equipment staff who know the site — the two sides cooperate.
How to Verify the Five Conversion Levels
After go-live, verify level by level; fix whichever level is broken:
- Signal level: are devices sampling in real time? Does the local display match the platform?
- Structured-data level: is data stored and queryable by circuit and time? Any gaps or jumps?
- Feature level: are key features — mean, peak, trend, harmonic share — computed and reviewable?
- Risk-assessment level: does every alarm have an explainable basis — why it fired and on what evidence?
- Action-suggestion level: does every suggestion carry who, when, and what, and can it be tracked to closure?
Only when all five levels pass does the system truly "conclude and act" — the verification result should be a fixed item of the monthly health check.
Eleven: Common Questions — Data Is There but Conclusions Still Do Not Come Out
- Poor data quality: gaps, jumps, and unsynchronized time corrupt assessment — fix the data before touching the model;
- Single-criteria judgment: looking only at single-parameter threshold crossing produces both false alarms and missed ones — add multi-parameter, position, and trend criteria;
- No one receives the conclusion: if suggestions never reach a work order and an owner, even accurate assessment stays on paper — bind action suggestions to the work-order flow, and only then does the loop count.
One-Line Summary of the Five Levels
From signal to action, every level is a gate: if the signal gate is closed, everything above is a castle in the air; if the data gate is closed, analysis has nothing to work with; if the feature gate is closed, assessment lacks evidence; if the assessment gate is closed, alarms cannot be trusted; if the action gate is closed, value never lands.
The tracing order is always bottom-up, and so is the fixing order — make signal and data solid first, and only then do assessment and action mean anything. This is why every "the system is useless" argument eventually returns to the sensing and data-quality layer. A team that internalizes this single ordering principle will spend far less time debating platforms and far more time fixing the one level that actually blocks value.
A practical way to run this bottom-up check in one meeting: project the five levels on a screen and put a traffic light on each — green if the level passes the verification above, red if not. Then fix the lowest red light first, and only then move upward. Most teams find the first red light sits at signal or data quality, which is exactly why this article keeps returning to the sensing layer: it is the cheapest level to fix early and the most expensive to fix late.
One more observation from field experience: when the five-level check is run honestly, the most common failure is not analytics — it is that the signal or data level fails silently for months. Devices keep blinking, gateways keep reporting, and nobody notices that the values stopped changing. That is why this article's recommendation is not "buy a better platform" but "verify the bottom levels on a fixed rhythm, and the value of everything above will follow." A five-minute check on the lowest two levels is the highest-return maintenance act in the entire monitoring lifecycle — do it on the first Monday of every month and the system will tell you when it needs attention, instead of the other way around, every single month without exception, even when everything looks fine.
Scope and Limitations
Reading page for KD-0024. Product capabilities (Taiyi control hub, Qianzhi engine's 7-dimension perception matrix and 238-dimension electrical parameter evaluation, Tianyan engine trend prediction, alarm linkage to work orders and responsible staff) come from the FEXLINK product knowledge base as product-documentation conventions. The "five-level conversion," "assessment watershed," and "action recommendation four elements" are this article's methodology for reference; specific assessment logic and action recommendations should be configured and confirmed by professional implementation staff based on site conditions. This page is not a specific project proposal.