 微物联研究院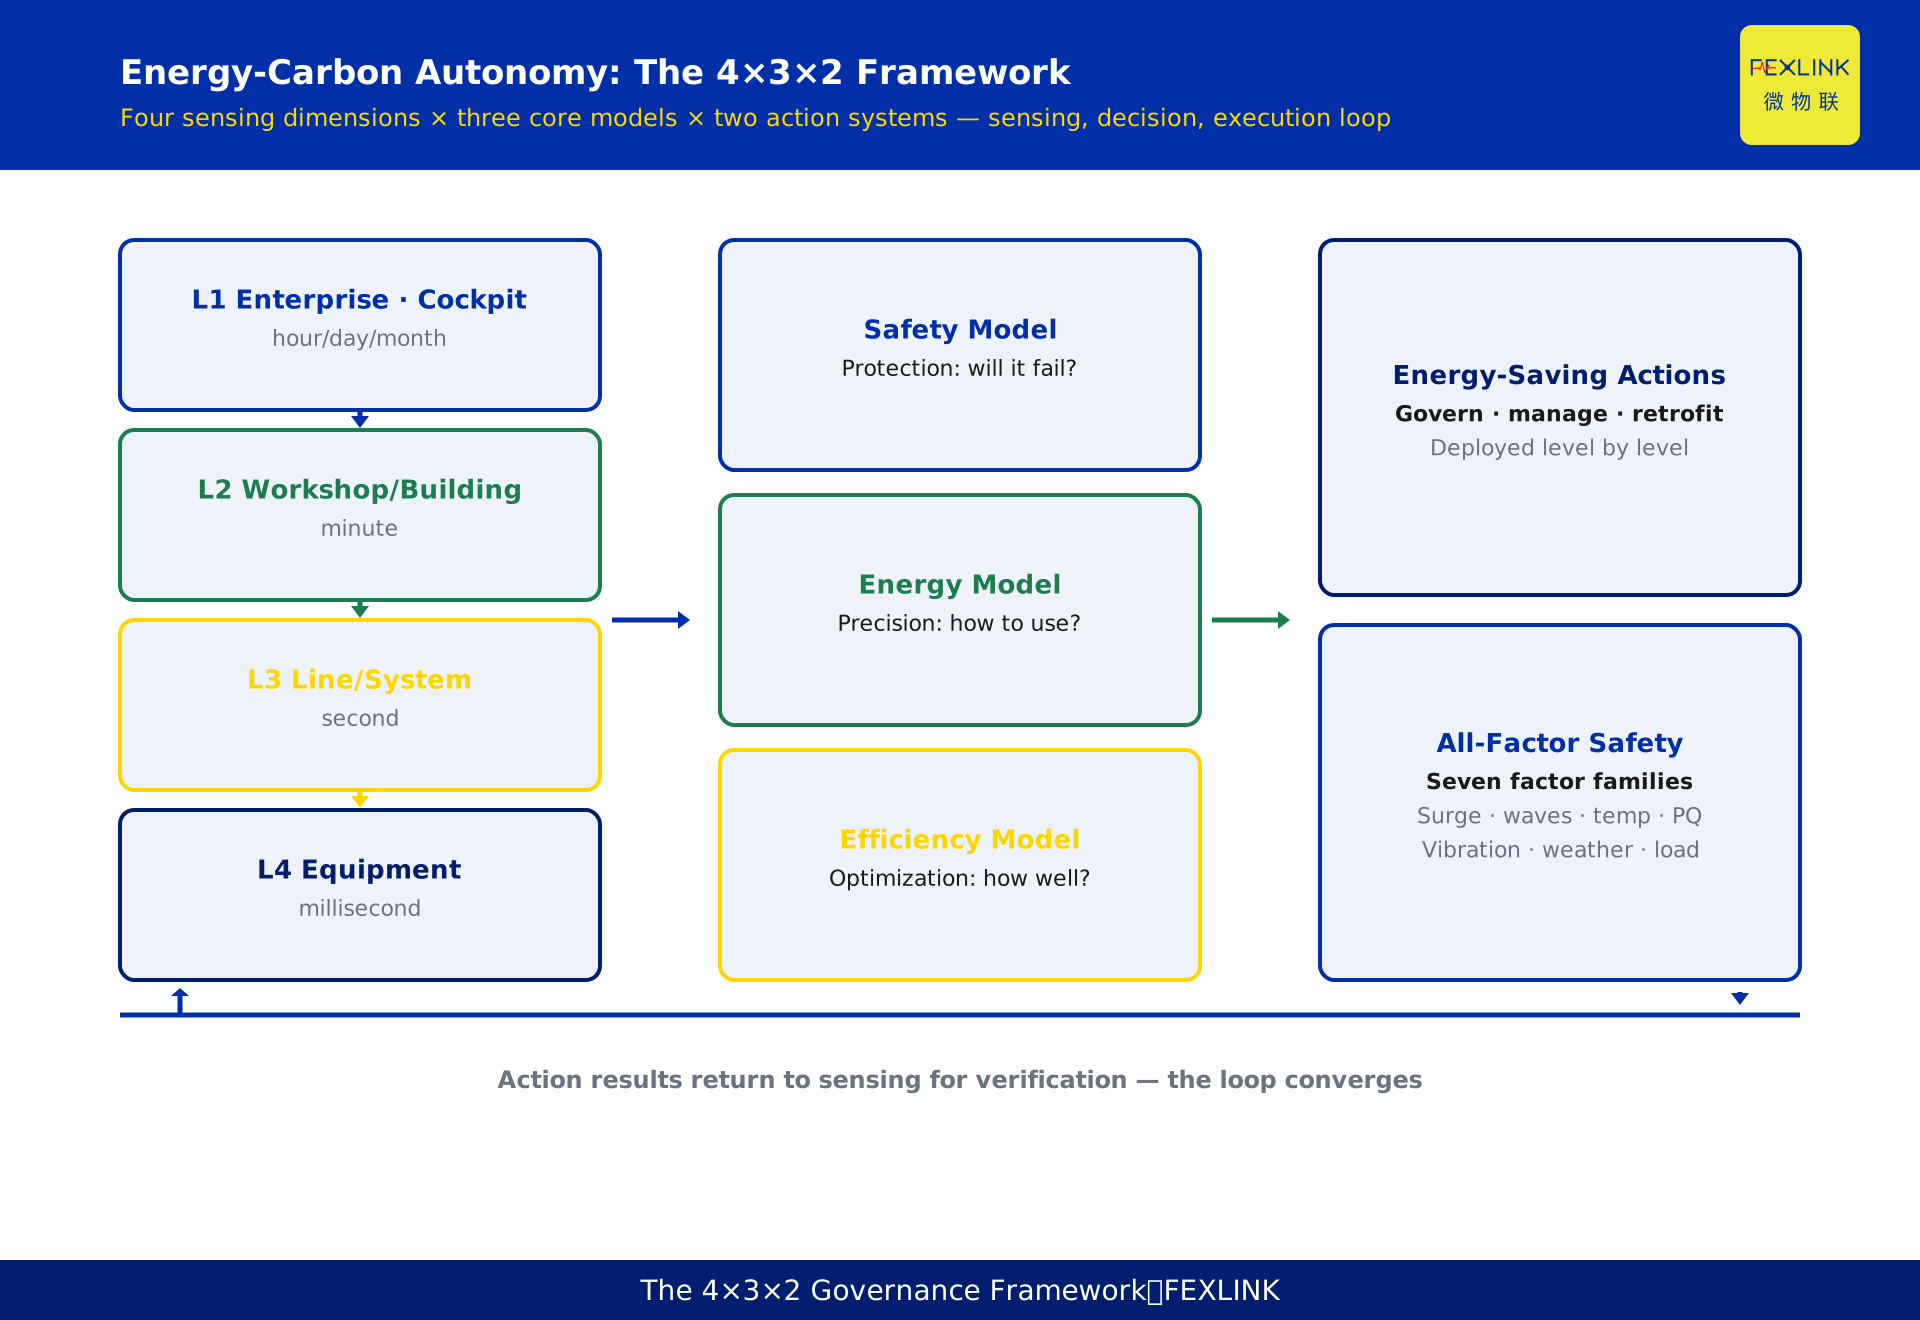
Direct Answer
Energy–carbon autonomy is not "one platform" — it is the 4×3×2 governance framework defined by FEXLINK's official whitepaper: four sensing dimensions (enterprise / workshop-building / production-line-system / critical-equipment) build a panoramic data foundation, three core models (Safety · Energy · Efficiency) provide the decision engine, and two action systems (Energy-saving · Safety) provide the execution levers. The underlying proposition is to re-express all enterprise consumption — people, places, energy — in one unified "carbon" scale, shifting from experience-based governance in the industrial era to algorithm-based governance in the intelligent era. The logic chain: the four sensing dimensions drill down from enterprise to equipment; the three models take on "protection, precision, optimization" responsibilities at every level; the two action systems turn model outputs into executable, assessable engineering actions — sensing, decision, and execution form a complete loop.
What Energy–Carbon Autonomy Really Means: One Carbon Scale for People, Places, and Energy
Before the 4×3×2, understand the underlying problem. Three categories of enterprise resources have traditionally been measured in three incompatible languages: people in labor hours (HR systems), places in space and equipment efficiency (OEE, utilization), and energy in kilowatt-hours. These metrics cannot be compared horizontally — is "5% higher people efficiency" or "8% lower energy use" worth more? Resource allocation cannot be optimized across dimensions because there is no common unit.
The breakthrough idea of energy–carbon autonomy: use carbon as the unified value scale. Energy emissions can be calculated, the carbon cost of human activity can be converted, and the efficiency of places (space, equipment) can be expressed as output per unit of carbon input — people-efficiency, energy-efficiency, and place-efficiency become one language: carbon efficiency. Carbon data is uniquely positioned: it is the only homogeneous data asset of an enterprise that simultaneously penetrates the four dimensions of operations, finance, compliance, and trade. Making carbon the common scale redefines running a business as "managing carbon."
This proposition dictates the framework's shape: re-expressing everything in carbon requires a complete sensing system from enterprise to equipment (the four dimensions), requires computing, dispatching, and optimizing carbon at every level (the three models), and requires turning conclusions into actions (the two action systems).
Why "autonomy" rather than just "management"? Because every link in the governance chain acts automatically: sensing acquires without manual meter reading, models decide without rule-of-thumb judgment, actions execute without layer-by-layer relay — exceptions are the only thing left for people. Autonomy is not unattended operation; it frees people from collecting data and passing messages so they can concentrate on judging exceptions and driving continuous improvement. That is also why the framework demands continuous, complete four-layer data: autonomy presupposes a reliable foundation, and wherever data gaps exist, the system is designed to degrade to human intervention.
Four Sensing Dimensions: From the Strategic Cockpit to the Equipment Nerve Endings
The four dimensions are the framework's data foundation. Top-down, sampling frequency goes from slow to fast and management objects from macro to micro — together forming a nervous-system-like drill-down path:
L1 Enterprise · Strategic Cockpit. Serves strategic decisions and external compliance. Sensing focuses on the main incoming line (0.5S-class high-voltage smart meters measuring active/reactive power, peak-flat-valley energy, power factor, voltage/current harmonics), high-precision flow meters for gas/water/steam, and PV/wind/storage metering with BMS. Key indicators: energy totals (daily/monthly/yearly electricity, gas, water, standard-coal equivalents), carbon emissions (Scope 1 direct, Scope 2 purchased-electricity indirect), clean energy (PV generation, self-consumption ratio, green-power reduction), efficiency (energy per unit of output value, energy per unit area), and cost (total energy cost, cost per kWh, peak-flat-valley share, demand-fee share). Sampling frequency: hourly/daily/monthly. Outputs: compliance reports and carbon value.
L2 Workshop/Building · Operational Benchmarking. The operational responsibility center for independent accounting units, achieving three-level precision metering: classification, breakdown, and per-tenant. Sensing uses a "total–branch–leaf" metering system (total = workshop/building main feeder; branch = lighting-sockets / power equipment / HVAC / special processes; leaf = data centers, laboratories and other critical zones), supplemented by temperature, humidity, CO₂, and people-counting sensors. Typical scenarios: peak identification on building load curves → demand-fee optimization; rooftop PV self-consumption monitoring → microgrid model and consumption actions; standby-energy audits outside work hours → behavioral savings; inter-workshop benchmarking → management ranking and assessment work orders. Sampling: minute-level. Outputs: ranking and response revenue.
L3 Production Line/System · Energy-Efficiency Optimization. Precisely locates and closes the loop on process energy efficiency, mining the deepest saving potential. Sensing uses "work-order–energy–process" three-way synchronization: MES supplies work order numbers, product codes, and planned output; meters supply second-level energy data; PLC/DCS supplies equipment running state and process parameters — aligned by timestamps. Traditional energy management can only answer "how much electricity did we use last month"; L3 can answer: how much more energy does product A cost than product B? Why is night-shift efficiency lower than day shift? How much extra electricity did one tiny air-compressor leak consume in the past 30 days? Sampling: second-level. Outputs: efficiency benchmarks and process optimization.
L4 Critical Equipment · Root-Cause Insight. Builds a self-sensing, self-analyzing, self-optimizing equipment management system built on real-time diagnostics, predictive maintenance, and algorithm-driven insight. Sensing embeds multimodal sensors: electrical (high-frequency power-quality analyzers, leakage current, high-frequency current), mechanical (vibration accelerometers, infrared temperature sensors — RMS vibration, bearing temperature, winding temperature), process (pressure, flow, speed), and clean-energy direct supply (DC power analyzers). Key capabilities: health fingerprints (normal-state vibration spectrum and current-waveform baseline per equipment); early fault signatures (bearing defect frequencies BPFO/BPFI, winding insulation degradation); remaining-life prediction (e.g., "Fan 5 drive-end bearing wear 70%, estimated remaining life 21 days"); deep OEE decomposition (root-cause analysis of availability, performance, and quality losses). Sampling: millisecond-level. Outputs: maintenance work orders and life predictions.
One line summarizes the four roles: L1 sees the whole and sets strategy, L2 manages units and benchmarks, L3 watches processes and mines potential, L4 inspects equipment and traces root causes.
Three Core Models: Safety, Energy, Efficiency
The three models are not isolated modules but three analysis layers on one data foundation — they must coexist and interact: optimization without safety is dangerous, energy without efficiency measurement is blind, and safety without energy dispatch is passive. At every level the three models take on "protection, precision, optimization":
Safety Model — "Will something go wrong?" (protection layer). L1 strategic early warning (energy-supply continuity, energy-resilience index; outputs storage SOC warnings and emergency-response plans); L2 electrical fire (trend and correlation analysis of three-phase unbalance, harmonics, leakage, overload; outputs targeted safety work orders folded into zone-leader KPIs); L3 system interlock (IF-THEN rules with millisecond response, issuing PLC stop/derate commands directly); L4 predictive maintenance (health baselines, machine-learning spectrum analysis, remaining-life prediction; outputs maintenance work orders specifying what/where/when).
Energy Model — "How should energy be used?" (precision layer). Core is dispatch: treat load, self-owned generation, storage, and purchased electricity as one optimizable system, solving for "lowest total energy cost, maximum clean-energy absorption" as a multi-objective function. L1 dispatch center uses mixed-integer programming with lowest total cost as the objective and constraints of fixed production plans, safe storage SOC range, and equipment power limits, solving the optimal decision for every instant of the next 24 hours — how much to buy from the grid, charge/discharge storage, and generate from PV; L2 flexible load (cluster identification + demand response); L3 process efficiency (unit-product energy benchmarks); L4 equipment physician (real-time performance-curve comparison).
Efficiency Model — "How well are we doing?" (optimization layer). Unifies people/place/energy efficiency into "carbon efficiency," outputting comparable, assessable, improvable indicators at every level. L1 strategic dashboard (carbon productivity, ESG benchmarking); L2 performance assessment (monthly leaderboards with work orders — e.g., a workshop efficiency monthly ranking with red/yellow/green visualization; persistently low-ranked units get management-improvement inquiry work orders folded into KPIs); L3 technical audit (three-layer benchmarking); L4 equipment specialist (deep OEE decomposition).
The three models align across all four dimensions: at every level, safety is watching, energy is dispatching, and efficiency is measuring — that is what "three models as one" means.
Two Action Systems: Energy Saving and Safety
Model outputs must become executable, assessable, quantifiable engineering actions — that is the purpose of the two action systems:
Four-Dimension Linked Energy-Saving Actions — deployed level by level, avoiding "one-size-fits-all" or campaign-style savings. L1 strategy and governance (savings institutions, annual target decomposition, new-energy project evaluation); L2 operations and management (standard procedures for HVAC/air compressors/lighting, coordinated operation, quota management); L3 process and optimization (process-parameter optimization, waste-heat recovery, production-line–utility interlock); L4 technology and execution (high-efficiency motor replacement, variable-frequency retrofits, pipeline-leak repair).
All-Factor Safety Actions — covering seven factor families for full-scene protection of machine rooms, equipment, production lines, utility systems, electrical, PV, and storage:
- Surge protection: internal/external overvoltage monitoring, SPD monitoring, equipotential monitoring, grounding resistance/status monitoring, lightning early warning;
- High/low-frequency waves: 1st–32nd harmonic features, high-frequency features, arc faults, partial discharge, equipment anomaly identification;
- Temperature/leakage: contact temperature, plug-box temperature, line temperature, live neutral, live ground, leakage current;
- Power quality: three-phase unbalance, zero/negative-sequence current, harmonic content analysis, energy-consumption signature analysis;
- Vibration/noise: equipment vibration signatures, abnormal noise identification, steady-state detection, tilt trend analysis;
- Micro weather station: ambient temperature/humidity, illuminance distribution, other meteorological information;
- Load signature: equipment energy signatures, running-state information, current-change analysis, predictive-maintenance indicators.
The pairing logic: saving actions solve "use less," safety actions solve "use reliably" — cost reduction presupposes safety, and safety investment is carried by the savings it enables. The two are two sides of one coin.
How the 4×3×2 Runs: Sensing, Decision, Execution
The 4×3×2 is not a stack of three checklists but one operating chain:
Sensing (four dimensions): from the enterprise gateway to critical equipment, four layers keep acquiring at their own frequencies, forming a drill-down data foundation from strategy to nerve endings — upper layers see trends, lower layers see details, and any layer's problem can be drilled down level by level.
Decision (three models): at every level the safety model first judges "will something go wrong" (protection), the energy model then computes "how should energy be used" (precision), and the efficiency model finally measures "how well are we doing" (optimization) — three analysis layers on one data foundation interacting and outputting leveled decisions.
Execution (two action systems): decisions land as actions — energy-saving actions deploy at L1–L4 as institutions, procedures, process changes, and retrofits; safety actions cover all scenes across seven factor families, outputting safety work orders, interlock commands, and maintenance work orders.
The loop closes because execution results return to the sensing layer and are re-measured — how much a saving measure saved and what a safety work order handled are verified by four-layer sensing data and fed back into the models' optimization targets. Energy–carbon autonomy is therefore not a one-time build but a continuously converging governance cycle.
Carbon Data as an Asset and External Integration
The 4×3×2 framework's value goes beyond cost reduction — it upgrades "carbon data" from compliance reports to an asset:
- Compliance: four-layer sensing natively supports Scope 1 (direct) and Scope 2 (indirect purchased-electricity) accounting; hour/day/month gateway metering satisfies energy dual-control and carbon-accounting reporting;
- Operations: carbon productivity (economic value per unit of carbon output) and energy per unit of output value enter the L1 strategic cockpit, tied directly to investment optimization and ESG benchmarking;
- Assets: PV green-power reduction, storage regulation capacity, and flexible-load response capability are all assets that can participate in green certificates, CCER, demand response, and the electricity spot market — the Energy model's L1 dispatch solution (how much to buy, charge/discharge, generate) provides the decision basis for such market participation;
- Trade: carbon efficiency as a comparable scale supports benchmarking and admission across workshops, plants, and supply chains, turning carbon performance into trade leverage.
The whitepaper states (company-disclosed): the framework can deliver investment payback within 18–24 months, a 15–25% reduction in comprehensive energy cost, and a 40–60% reduction in unscheduled downtime of critical equipment.
Implementation Rhythm: See Clearly, Compute Clearly, Control
Progress follows the official three-phase route, each with quantifiable milestones:
Phase I (See Clearly — L1/L2 foundation): deploy the L1 cockpit, complete main-feeder metering, build the total–branch–leaf three-level metering system, integrate ERP/MES for finance-operations alignment, establish Scope 1/2 emission baselines, and start PV/storage feasibility studies. Milestones: ≥80% sensing coverage, ≥95% data completeness, ≥10 savings projects in reserve.
Phase II (Compute Clearly — L3/L4 deepening): work-order–energy–process synchronization on key lines, health fingerprints for ≥10 critical equipment items, predictive-maintenance work orders integrated with CMMS, PV+storage online with electricity-market access, and green-certificate/CCER participation plans. Milestones: ≥90% critical-equipment coverage, ≥85% prediction accuracy, 10–15% energy-cost reduction.
Phase III (Control — AI autonomy): private deployment of an energy large model, digital twins of key lines and plants, virtual-power-plant participation in the spot market, carbon-asset management (CCER/green certificates/carbon finance), and external energy-efficiency services.
Data requirements run through every phase: sensing coverage and data completeness determine model input quality — missing measurement points and data gaps make the three models' outputs untrustworthy; action execution must be verified back at the sensing layer for continued convergence.
Common Mistakes to Avoid
- Treating the 4×3×2 as three separately purchased "modules." The three models must interact on one data foundation; built apart, they become three islands.
- Building sensing without models. Meters without models are a digital showcase, not decision-making.
- Doing energy saving without safety. Optimization without safety protection is dangerous — the Safety model is the first protection layer.
- Leaving actions at the report stage. The two action systems exist to produce executable, assessable, quantifiable engineering actions, not recommendation lists.
- Jumping to L3–L4 without L1–L2. Without the sensing foundation and accounting baselines, process optimization and equipment prediction have no data to stand on.
Scope and Limitations
The "4×3×2 energy–carbon autonomy governance framework" (four sensing dimensions, three core models, two action systems, three-phase route) described on this page comes from FEXLINK's official Energy–Carbon Autonomy Whitepaper and represents the product/solution perspective. Figures such as "18–24 months payback, 15–25% comprehensive energy-cost reduction, 40–60% unscheduled-downtime reduction" are company-disclosed whitepaper claims; actual results depend on site conditions, data quality, and implementation. Related product capabilities (0.5S-class high-voltage smart meters, high-frequency power-quality analyzers, multimodal sensors, the ESX edge gateway, the digital electrical intelligent supervision system, and the energy–carbon autonomy system) come from the FEXLINK product knowledge base. Terms such as "Scope 1/Scope 2," "CCER/green certificates," and "demand response" are public concepts; specific accounting and market participation must follow the latest policies and authority requirements. Example scenarios (an industrial park, a factory, an airport, a port) are anonymized illustrations and do not refer to any specific customer.