 微物联研究院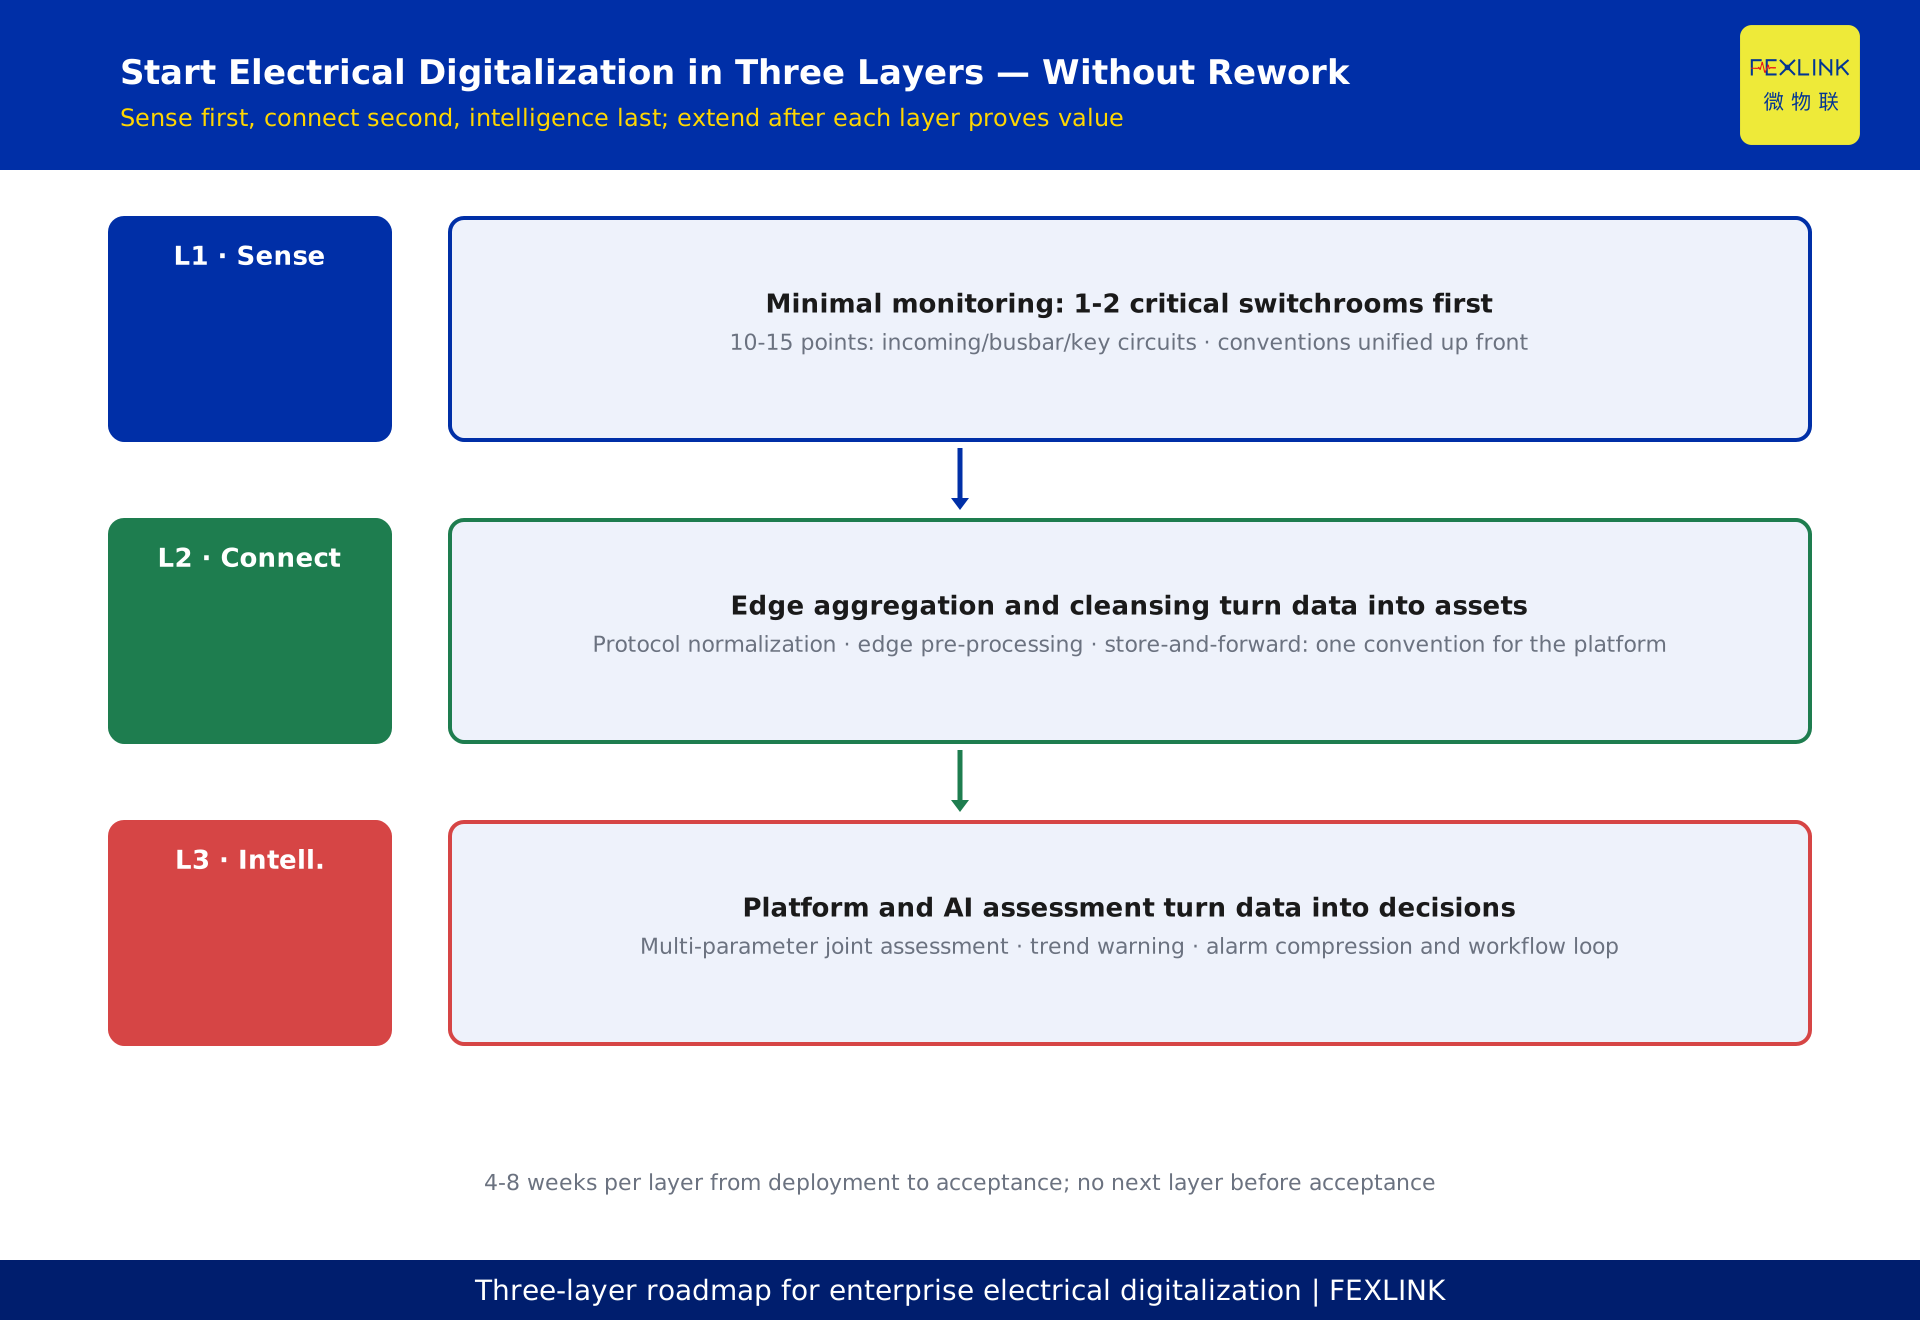
# How an Enterprise Starts Its Electrical Digitalization: a Three-Layer Roadmap
Direct Answer
Stop trying to build everything at once. Start electrical digitalization in three layers: first, a minimal monitoring footprint in one or two critical switchrooms; second, edge aggregation and data cleansing that turn raw readings into usable data; third, a platform with AI-based assessment. Each layer has explicit acceptance criteria, and you extend only after the value of the current layer has been verified. The payoff: investment is split into small, verifiable steps, and you avoid the most common failure — a large platform that nobody uses because the data behind it was never made reliable.
For energy managers, plant IT leads, and facility owners, this article covers four questions: why the "all at once" approach fails; what each layer does and how to execute it; how to know when a layer is done; and the pace, budget, and pitfalls of the three-layer roadmap. All examples are anonymized (an industrial park, a factory, an airport) and refer to no specific project.
1. Why "All at Once" Fails
A familiar scenario: a park's leadership approves a full electrical digitalization package — platform, gateways, and hundreds of sensors installed within a year. The sensors go in, data starts flowing, but no one can say what the data should be trusted for. The dashboard looks impressive; operators still watch only voltage and current. A year later, the equipment team cannot justify the spend, and phase two is cancelled.
Almost every failed project fails the same way: the platform was treated as the goal and data production as a by-product. The real value chain is "sense → connect → intelligence." Reliable field data comes first, smooth data movement second, and intelligent assessment last. Reverse or skip a step, and you rebuild.
Skipping layers has concrete consequences. Skip layer one and build the platform: the interface looks fine, but underneath sits fragmented, intermittent, inconsistent data — numbers you can neither manage nor decide with. Skip layer two and go straight to AI: the models train on spikes, misaligned timestamps, and mixed units, so outputs are not trusted, engineers drift back to manual meter reading, and the investment turns into sunk cost. Build the first two layers properly, and the platform has reliable raw material, conclusions get used, and value closes the loop.
The roadmap translates the value chain into three executable layers:
- Layer 1 — Sense: a minimal monitoring footprint in critical switchrooms; answers "do we have data?"
- Layer 2 — Connect: edge aggregation and cleansing; answers "is the data usable?"
- Layer 3 — Intelligence: platform and AI assessment; answers "what decisions does the data enable?"
Each layer solves exactly one problem and must have measurable acceptance criteria, detailed next.
2. Layer One: a Minimal Footprint in Critical Switchrooms
Layer one is not about whole-site coverage. It is about measuring the most important electrical quantities accurately and completely in one or two critical switchrooms.
Why limit the scope? Because the biggest uncertainty in electrical digitalization is not the technology — it is what field data actually looks like. The same current measurement has a completely different normal range in a loaded workshop versus a standby circuit. The same transformer temperature has a different baseline in summer versus winter. You can only learn these site-specific characteristics by installing equipment and collecting data for a while. A small, complete first pass is far safer than a large, scattered rollout.
What to measure first, in priority order:
- Critical equipment status: voltage, current, temperature, and leakage on transformers, incoming panels, and busbars — the basis for judging hidden faults;
- Important circuit loading: current and power-quality parameters on key production lines — the basis for judging whether loading is reasonable;
- Environmental and process parameters: switchroom ambient temperature and panel temperature rise, combined with electrical quantities for joint assessment.
A typical 10 kV incoming switchroom starts with: the incoming breaker, main busbar, one or two important outgoing circuits, and the transformer low-voltage side. Fewer, better-chosen points beat a full sweep — the goal is clarity, not coverage.
How do you choose which points matter most? Score candidate points on three axes: risk (how much a failure here hurts — a main transformer scores higher than an ordinary outgoing), actionability (can you act when an anomaly appears — busbar temperature triggers maintenance, ambient humidity only gets logged), and cost (retrofit difficulty and cabling). Rank by "risk × actionability ÷ cost" and take the top 10–15 points for layer one. An electrical engineer and a shift leader can score them in half an hour.
One more thing often missed: define the data conventions in layer one. RMS or instantaneous? Conductor temperature or ambient? What reporting interval? If these are not settled up front, layer two faces "two different voltage units" chaos that is expensive to fix. Insist that all points follow one data model — dimensions, units, time base, reporting period — from day one. This is also why co-sourced sensing equipment is recommended: mixing vendors multiplies the alignment work.
Layer-one hardware is monitoring modules, controllers, and smart meters (for example FSA/ESF/ESC/EST/ESA controllers and ZSA/ESA meters) that convert voltage, current, temperature, and leakage into structured data. Note the intent: layer one buys data capability, not sensor count. The same controller delivers completely different data quality depending on parameter configuration, sampling period, and conventions — which determines what layers two and three can build on.
3. Layer One Acceptance: Three Checkable Results
Do not judge layer one by how many devices were installed. Judge it by three results:
- Coverage is stable: the selected critical switchroom reports continuously on incoming, busbar, and important circuits for seven days without gaps;
- Data quality passes: voltage, current, and temperature points show ≥98% completeness, no visible spikes, glitches, or misalignment — confirmed by a formal "data health check";
- Three questions are answerable: operators can answer — "what was yesterday's peak load in this switchroom," "which circuit's temperature has been rising recently," "has incoming voltage been fluctuating abnormally."
The third criterion matters most. If the data cannot answer these questions, the points, the quality, or the people are wrong — layer one is not done, and moving to layer two is premature.
In practice, one factory found an extra payoff during this stage: seven days of continuous monitoring exposed two chronically overloaded circuits, and load balancing followed. That is the kind of return a minimal layer-one footprint can already deliver.
4. Layer Two: Edge Aggregation and Cleansing Make Data an Asset
Layer one answers "do we have data." Layer two answers "is it usable." Many projects stall right after layer one because data exists but is scattered, inconsistent, and uneven in quality — the platform cannot ingest it, or ingests dirty data.
Layer two has three core jobs:
- Protocol normalization: field devices come from different vendors speaking different protocols (Modbus, DL/T 645, and others); edge gateways unify them into one standard data model so the platform sees a single convention;
- Edge pre-processing: cleansing close to the source — removing spikes, compensating temperature drift, aligning timestamps per point, computing basic statistics (mean, extrema, rate of change) — so what reaches the platform is clean and directly usable;
- Aggregation and store-and-forward: gateways consolidate multiple switchrooms and buffer data locally during outages, resuming transmission automatically — this is what makes "no data lost on the chain" true rather than a slogan.
The layer-two product form is intelligent edge computing gateways (for example the ESX intelligent edge gateway, plus CW/CX/CC series gateways), acting as the first processing plant for field data. Gateway compute, point capacity, and store-and-forward capability bound how much data the enterprise can handle.
Four gateway deployment points deserve attention up front. Location: place gateways near the switchroom, in the same network domain as the sensing devices, to avoid latency and packet loss from cross-segment routing. Capacity: count the points and protocols this layer must carry before choosing a gateway, and keep 30%+ headroom so next year's expansion does not require a swap. Store-and-forward: switchroom networks are not always reliable; a gateway must buffer locally and resume automatically — this criterion decides whether "no lost data" is real. Security: gateways need device identity management and access control so the field data chain cannot be tampered with.
The most common mistake in layer two is "platform-heavy, edge-light" — budget and attention go to the dashboard while edge aggregation merely forwards data, so the platform receives un-cleansed raw data and AI assessment has nothing to work with. Edge aggregation is not optional; it is the gate for data quality.
5. Layer Two Acceptance: Three Checkable Results
- One convention: every point through the gateway appears on the platform in a single data model — same dimension, unit, and time base, with no "two voltage units" split;
- History is traceable: any point can show 90+ days of continuous history, with gaps explicitly marked and explainable;
- Cleansing works: platform values compared against field instruments stay within tolerance on key points; spikes and jumps are removed at the edge, and dirty-data share on the platform drops measurably.
One airport project ran a simple, effective verification at this stage: two independent data paths from the same field point — one via gateway cleansing, one raw — were compared on the platform for seven days, confirming that the cleansing chain measurably improved usability. That is the first step of "data becoming an asset."
6. Layer Three: Platform and AI Assessment Turn Data into Decisions
With data prepared, layer three introduces intelligence. Its goal: move from "seeing data" to "data giving decision support" — alarms upgraded from threshold triggers to multi-parameter joint assessment, from "something is abnormal" to "this is the root cause," from post-event handling to trend-based early warning.
Layer-three work, in priority order:
- Unified monitoring and alarms: all switchrooms monitored on one platform, with alarm grading, deduplication, and compression so operators are no longer flooded;
- Multi-parameter joint assessment: temperature, current, harmonics, and leakage read together to distinguish normal fluctuation from real hazard — far more reliable than single-threshold judgment;
- Trend and prediction: historical analysis detects degradation processes early (sustained temperature rise, slowly growing leakage), turning "power off after the fact" into "maintain before the fact";
- Workflow linkage: alarms connect to work orders and maintenance flow, closing the loop from detection to assessment to action.
A concrete example makes joint assessment tangible. A circuit's temperature rises slowly from 42℃ to 58℃ over 12 hours while current stays flat — a classic "connection degrading" signal; trend assessment suggests "schedule an outage within 2 hours" instead of waiting for a threshold breach. Conversely, the same circuit jumping 20℃ in five minutes while current swings widely is a short, heavy load event — the system should classify it as normal operation, not a hazard. Same "temperature rise," completely different risk. Single-parameter, single-threshold logic cannot tell them apart; multi-parameter joint assessment with trend support can. That is the core value of layer three over layer one's "just watch the meters."
Layer-three products are platforms and AI applications such as the Taiyi smart-control hub (with engines like Qianzhi and Tianyan for multi-dimensional assessment and trend prediction), typically delivered end-to-end through a digital electrical intelligent supervision system. The value proposition: electrical management moves from people watching meters to systems supporting decisions.
7. Layer Three Acceptance: Three Checkable Results
Layer three is finally judged by changed behavior:
- Alarms are effective: daily actionable alarms are clearly below the old noise level, and operator response rates to alarms rise noticeably — no more "so many alarms that nobody looks";
- Decisions close the loop: over a month, a meaningful share of hazards found by the system enters the maintenance plan and is completed, with a countable closed-loop record;
- Management uses it: monthly energy or equipment reviews are presented from system data, not manual spreadsheets — the most direct sign that the system is in use.
When these three hold, layer three's value has materialized. Only then consider horizontal expansion — extending layer one from one or two switchrooms to more rooms and plants. Because layers one and two have already worked out "collect → cleanse" as a repeatable routine, marginal cost drops noticeably.
8. Pace, Budget, and Pitfalls of the Three-Layer Roadmap
A practical operating rhythm:
- Timeline: 4–8 weeks per layer from deployment to acceptance; three layers deliver first-phase results in 3–6 months. Do not compress acceptance — it is the insurance against rework;
- Budget: approve per layer rather than all at once. Layer one stays small (one or two switchrooms); scale by ratio after verification. Platform spend belongs in layer three, avoiding the "platform first, data later" misalignment. As a reference, common projects split roughly 40–50% to sensing (devices and installation), 20–30% to connectivity (gateways and network retrofit), and 30–40% to platform and intelligence; ratios shift with enterprise size and existing IT base, but "sensing plus connectivity at least half" is a defensible rule of thumb;
- Ownership: every layer needs a named owner — electrical/equipment for layer one, IT-and-equipment joint for layer two, and equipment+energy+IT for layer three. Without someone continuously looking at the data, any layer decays. Give layer one a "data watcher" in particular: not necessarily a full-time role, but someone who reviews a data-quality report weekly and answers "is the data still complete and accurate?" That is how the layer's data stays alive.
The classic pitfalls, summarized:
- Skipping layers: going straight to AI without data-quality verification trains models on dirty data, and results drift further from reality;
- Overscoping: a hundred points in the first switchroom, budget spent before the data patterns are understood;
- Platform-heavy, sensing-light: the best platform with casually configured edge aggregation — the chain breaks at the most critical link;
- Build-and-abandon: after acceptance, nobody maintains or watches, and three months later data gaps go unnoticed.
Avoiding these four raises the odds of the roadmap substantially. One more principle: at the end of every layer, codify the approach — how the point list was decided, how conventions were unified, how acceptance was run — into reusable documents and templates. Horizontal expansion after layer three will copy these templates, and marginal cost is what actually drops; re-inventing the process on every new switchroom is the expensive path.
Scope and Limitations
This three-layer roadmap fits: manufacturing plants, parks, airports, data centers, and other building or industrial sites with clear power-distribution management needs; a prerequisite is a basic electrical management organization (an equipment or energy owner exists) and switchrooms with retrofit conditions (space, power, network). It does not fit: greenfield versus retrofit differences — a new site may merge the cadence of layers one and two, but the acceptance logic stays; enterprises without even a basic electrical register should strengthen management fundamentals before digitalization, or all three layers lose their foundation.
Product capabilities mentioned (monitoring modules/controllers/smart meters, the ESX intelligent edge computing gateway, the Taiyi smart-control hub, and the digital electrical intelligent supervision system) follow the FEXLINK product knowledge base as product-documentation conventions; specific selection, parameters, and implementation scope must be confirmed by professional implementation staff against site conditions. This article is not a specific project proposal. All example data and scenarios are anonymized illustrations (an industrial park, a factory, an airport) and do not represent any real project.