 微物联研究院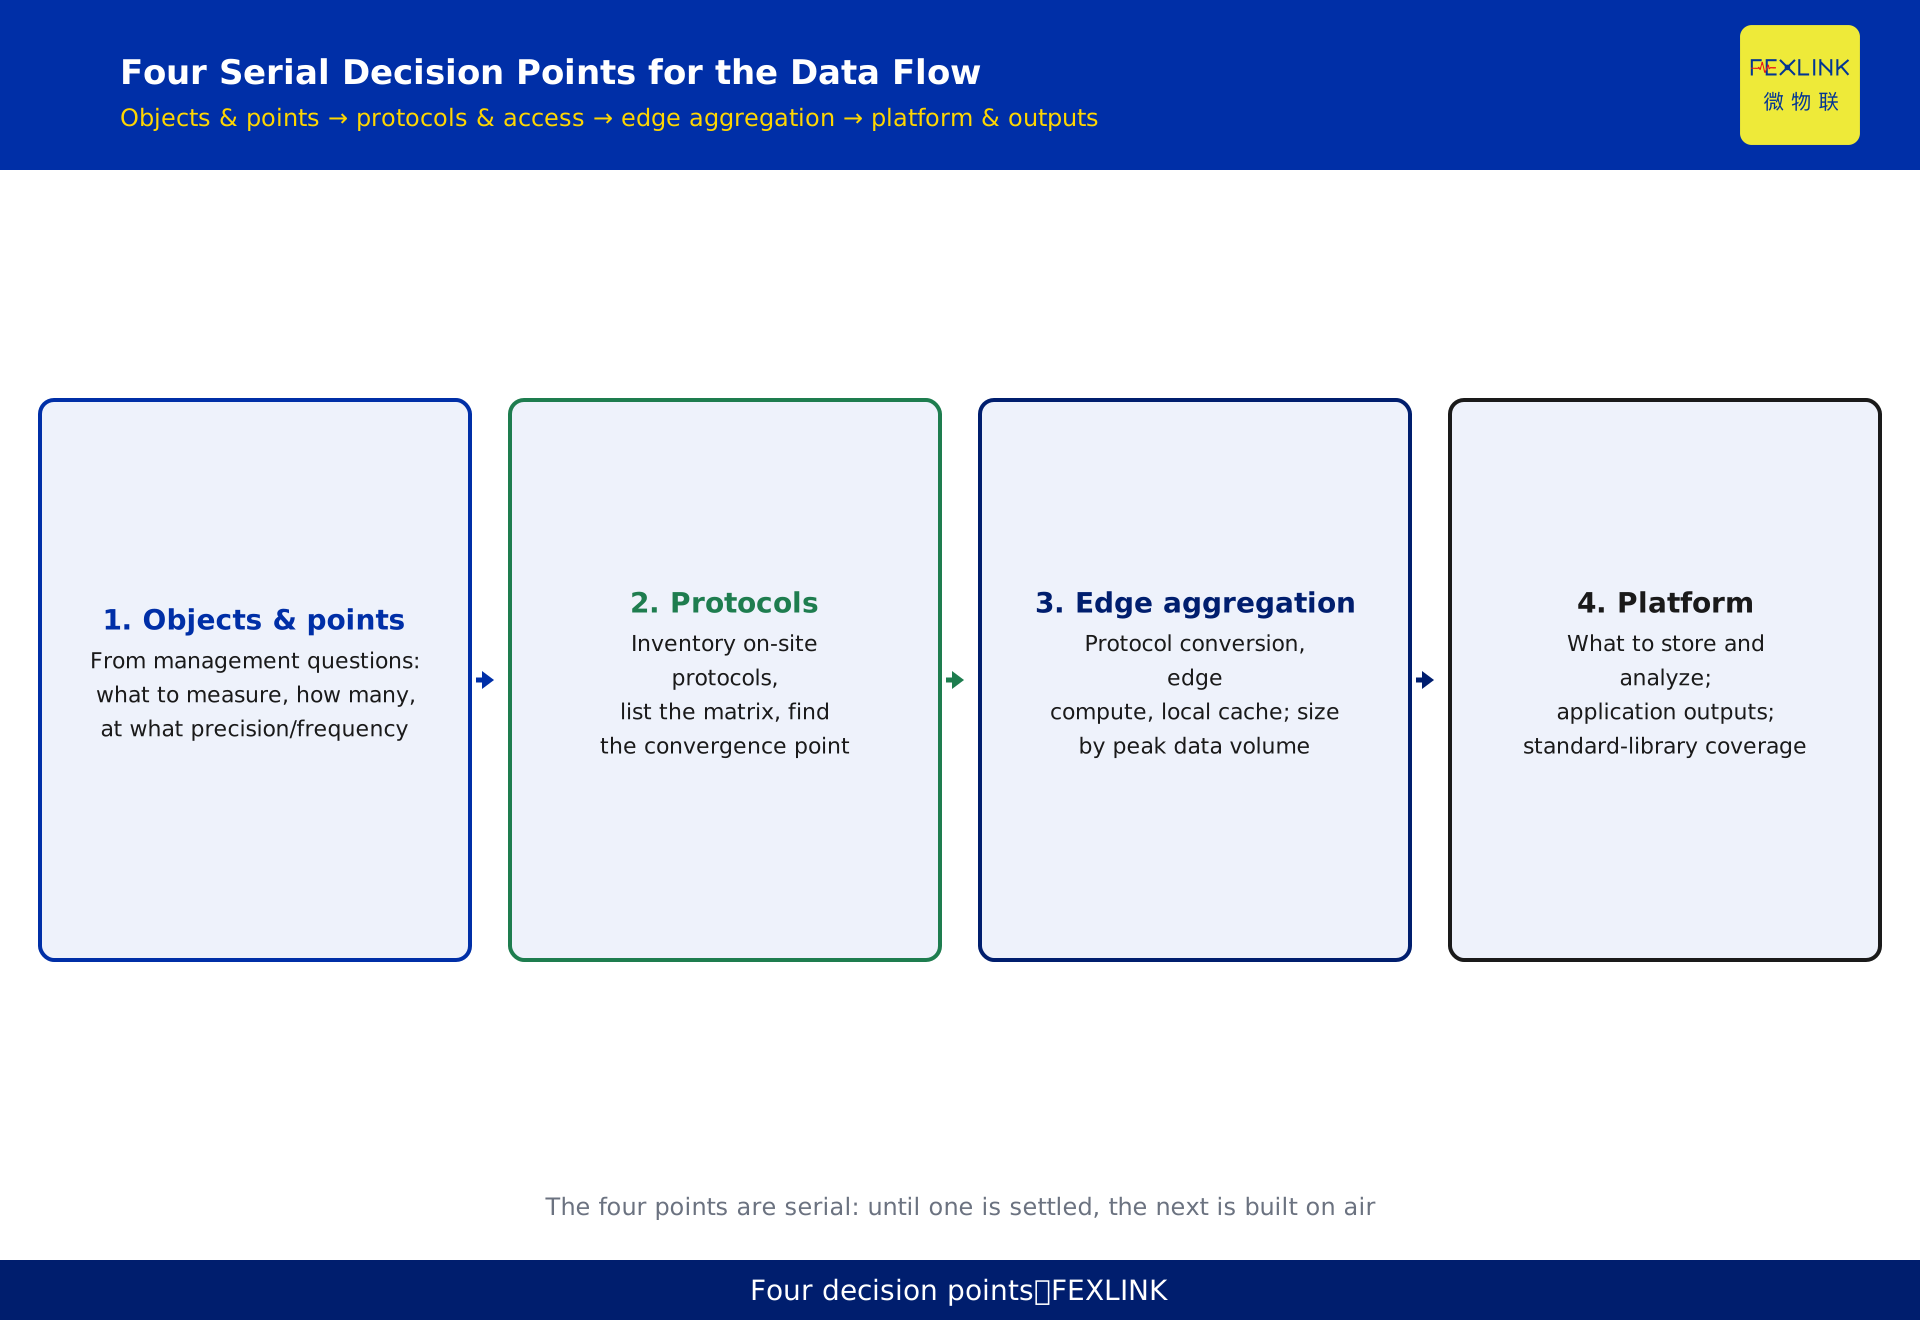
Direct Answer
Many edge-cloud projects get the order wrong: they buy a pile of products first and then try to wire them together, and the result is mismatched data, systems that will not talk to each other, and rework costs far exceeding any time saved. Direct answer: define the data flow first, then pick products — work backward from "which management questions must be answered" to the data needed, design the data flow (acquisition points → protocols → edge aggregation → platform), and finally check every product against that flow. When the order is reversed, every later step pays for earlier mistakes; when the order is right, product selection becomes "ticking items off a list" instead of "buy and try."
Typical Rework When Products Come First
When products come first, the rework site usually looks like this:
Measurement points do not match management questions. Equipment is bought, sensors are installed, data flows — but the indicators leadership wants have no corresponding points; say you need to analyze circuit losses but no branch current is measured. Adding points means re-wiring from scratch.
Protocols cannot connect. Procurement never unified the communication protocols, and on site you find that device A's RS485 and device B's communication method cannot join, the gateway choice does not match, and you patch together unstable temporary converters.
Data reaches the platform with mixed semantics. Two collectors parse the same meter data with different rules, so one field carries two meanings in the platform, and analytics become unreliable.
Edge and platform capabilities are mismatched. The gateway is too small, and packets drop when volume grows; the platform is too light, and edge processing is wasted. Rework is not about adding one device; it is about re-laying the whole chain.
The common root of all this rework: a product-first order makes the data flow bend to the products, instead of products serving the data flow.
Step One: Derive Data Needs from Management Questions
The first step of defining the data flow is to go back to the management questions themselves:
Write down the questions to answer. For example: how is the health of distribution circuits? Where does energy consumption go? Which equipment is degrading? The question list drives every downstream design.
Derive data needs from questions. Answering "circuit health" needs voltage, current, temperature, and leakage-current points; answering "energy destination" needs per-circuit metering. Questions are the source of needs; points are the result of needs.
Derive the data tier for each question. Which layer answers each question? Some questions are answered by raw sensing-layer data, some need edge-processed data, some must wait for platform-level synthesis. Different tiers mean entirely different acquisition and processing configurations.
Derive precision and frequency. Fault diagnosis needs high-frequency sampling and trend data; energy statistics can use periodic data. Precision and frequency decide the acquisition equipment grade, and the storage and bandwidth cost.
With the question list written down, data needs become a translation task, not a guessing game.
Designing the Data Flow: Four Decision Points
Between management questions and the product list sits data-flow design, with four decision points settled in order:
Decision one: acquisition objects and measurement points. Which equipment and circuits are acquired? What parameters, precision, and frequency per point? This decides what the sensing layer carries and how much.
Decision two: protocols and access. What protocols do devices speak (RS485, Modbus, Ethernet, and so on)? How does data get in? The protocol matrix must be listed up front — it is the basis for choosing gateways.
Decision three: edge aggregation capability. How does data aggregate and process at the edge? What protocol conversion, edge computing, and local caching are needed? This decides edge device specifications.
Decision four: platform and application output. Where does data converge? What must the platform store and analyze, and what applications does it expose (dashboards, alarms, reports)? This decides platform selection and configuration.
The four decision points are serial, not parallel: until the previous one is settled, the next is built on air.
Decision One: Acquisition Objects and Measurement Points
Acquisition objects and points are the source of the data flow and the easiest step to get wrong:
List equipment from the management questions. First bound the scope: which distribution circuits, which critical equipment, which environmental parameters appeared in the questions. Leave out-of-scope equipment uninstalled, so you do not over-spread at the start.
Define points per object. What does a circuit need: current, voltage, temperature, leakage? What does a device need: operating status, load rate, temperature rise? The point list must map one-to-one to the question list, so every point has an answer to "why is this installed."
Set precision and frequency. Diagnosis points sample at high frequency; statistics can sample low. Precision and frequency are not "higher is better" — they directly drive acquisition cost and data volume. Enough is enough.
Leave extension margin but do not over-provision. Reserving a few extension points for future needs is fine; "fill every circuit" is not design, it is waste — the most common mistake at decision one.
When the point tier is clear, protocols, edge, and platform all have a target.
Decision Two: Protocols and Access
Protocols are the most pitfall-prone link in an edge-cloud stack. Decision two must list the protocol matrix up front:
Inventory on-site protocols. What protocols do existing devices speak (RS485, Modbus RTU/TCP, Ethernet, Zigbee, and so on)? What will newly installed devices use? Put them all in one table.
Find the convergence point. Where do devices on different protocols converge? The usual practice: sensing-layer devices connect to edge gateways by proximity, and the gateway performs protocol conversion and edge aggregation — the gateway is the convergence point, not each device "going online by itself."
Confirm edge access capacity. How many devices, data points, and protocols can a gateway handle must be checked against the matrix. For example, a single gateway supporting 30 devices and 2000 data points is a common specification; if the site exceeds it, plan multiple gateways or a larger model.
Uplink and local caching. Does the edge device go up by Ethernet or 4G, and is wired available on site? When the network drops, can data be cached locally and re-sent after recovery? These must be settled on site, not patched after go-live.
With the matrix complete and the convergence point identified, gateway selection has hard evidence.
Decision Three: Edge Aggregation Capability
Past acquisition and access, the third decision point is how the edge layer processes data:
What the edge does. Not all data goes straight to the platform. The edge handles: protocol conversion, data normalization, edge computing (simple interpretation, limit judgment), and local caching. Which processing stays at the edge and which goes to the platform must be drawn in the data-flow design.
Size by data volume. More access points and higher sampling frequency mean more compute and storage pressure on edge devices. Gateway specifications (access scale, processing capability, storage) should be sized by peak data volume, not device count — two projects with the same device count but different sampling rates need different grades.
Offline tolerance. When on-site networks are unstable, edge caching is the guarantee of data integrity. Cache capacity should cover the expected outage duration.
Edge computing is not platform computing. The edge suits deterministic fast interpretation; complex analysis belongs to the platform. Stuffing platform analytics into an edge device is a common over-design.
Edge capability is set by the data flow's needs — no more, no less.
Decision Four: Platform and Application Output
The last stop of data-flow design is the platform and its application output:
What the platform stores and analyzes. Data volume decides the storage scheme (time-series storage); management questions decide analytics (trends, alarms, correlation analysis). Match platform selection first to the question list, then to data scale.
What the application output is. Dashboards, alarm notifications, analytics reports, mobile inspection — each output maps to one platform capability. List the outputs first, then verify the platform covers them.
Standard compliance. If management goals involve standard-limit comparison (GB, IEC, and so on), the platform needs a built-in standard library or custom interpretation rules. This requirement must be written into the data-flow stage, not discovered after buying.
The platform is the endpoint of the data flow; if the endpoint is not designed, everything collected upstream is just piled-up data.
Four Steps to Check the Product List against the Data Flow
Once data-flow design is complete, product selection becomes a four-step check:
Step one: check sensing devices against the point list. For every point's parameter, precision, and frequency, is there a corresponding sensor or monitoring module model? The point list is the only basis — do not be steered by sales talk.
Step two: check edge gateways against the protocol matrix. Does the gateway support the protocols, access scale, and data-point capacity required by the matrix and total points? Every gap is a future rework point.
Step three: check platform capacity against data scale. Can storage carry the volume? Can analytics cover the management questions? Does the standard library cover the needed standards?
Step four: check the whole chain against application output. From sensing to edge to platform to application, can data run through as designed? Walk the data-flow diagram against the product list; if any step mismatches, solve it here — not at go-live.
After the four-step check, the product list is simply the physical form of the data flow, and rework disappears.
Scope and Limitations
The "data flow first, products second" implementation order in this article is an engineering methodology for edge-cloud electrical-monitoring projects, intended for system integrators and enterprise IT/facility leads making architecture decisions; data needs and on-site conditions vary widely by project, and points, protocols, edge specifications, and platform capacity must be determined by actual site surveys. The edge gateway access scale mentioned (e.g., 30 devices and 2000 data points per gateway) follows the FEXLINK product knowledge base for the ESX gateway series; actual selection depends on the vendor's current models and the final confirmed list. Scenarios are anonymized (a generic park, a generic factory, and similar references) and do not refer to any specific customer.