 微物联研究院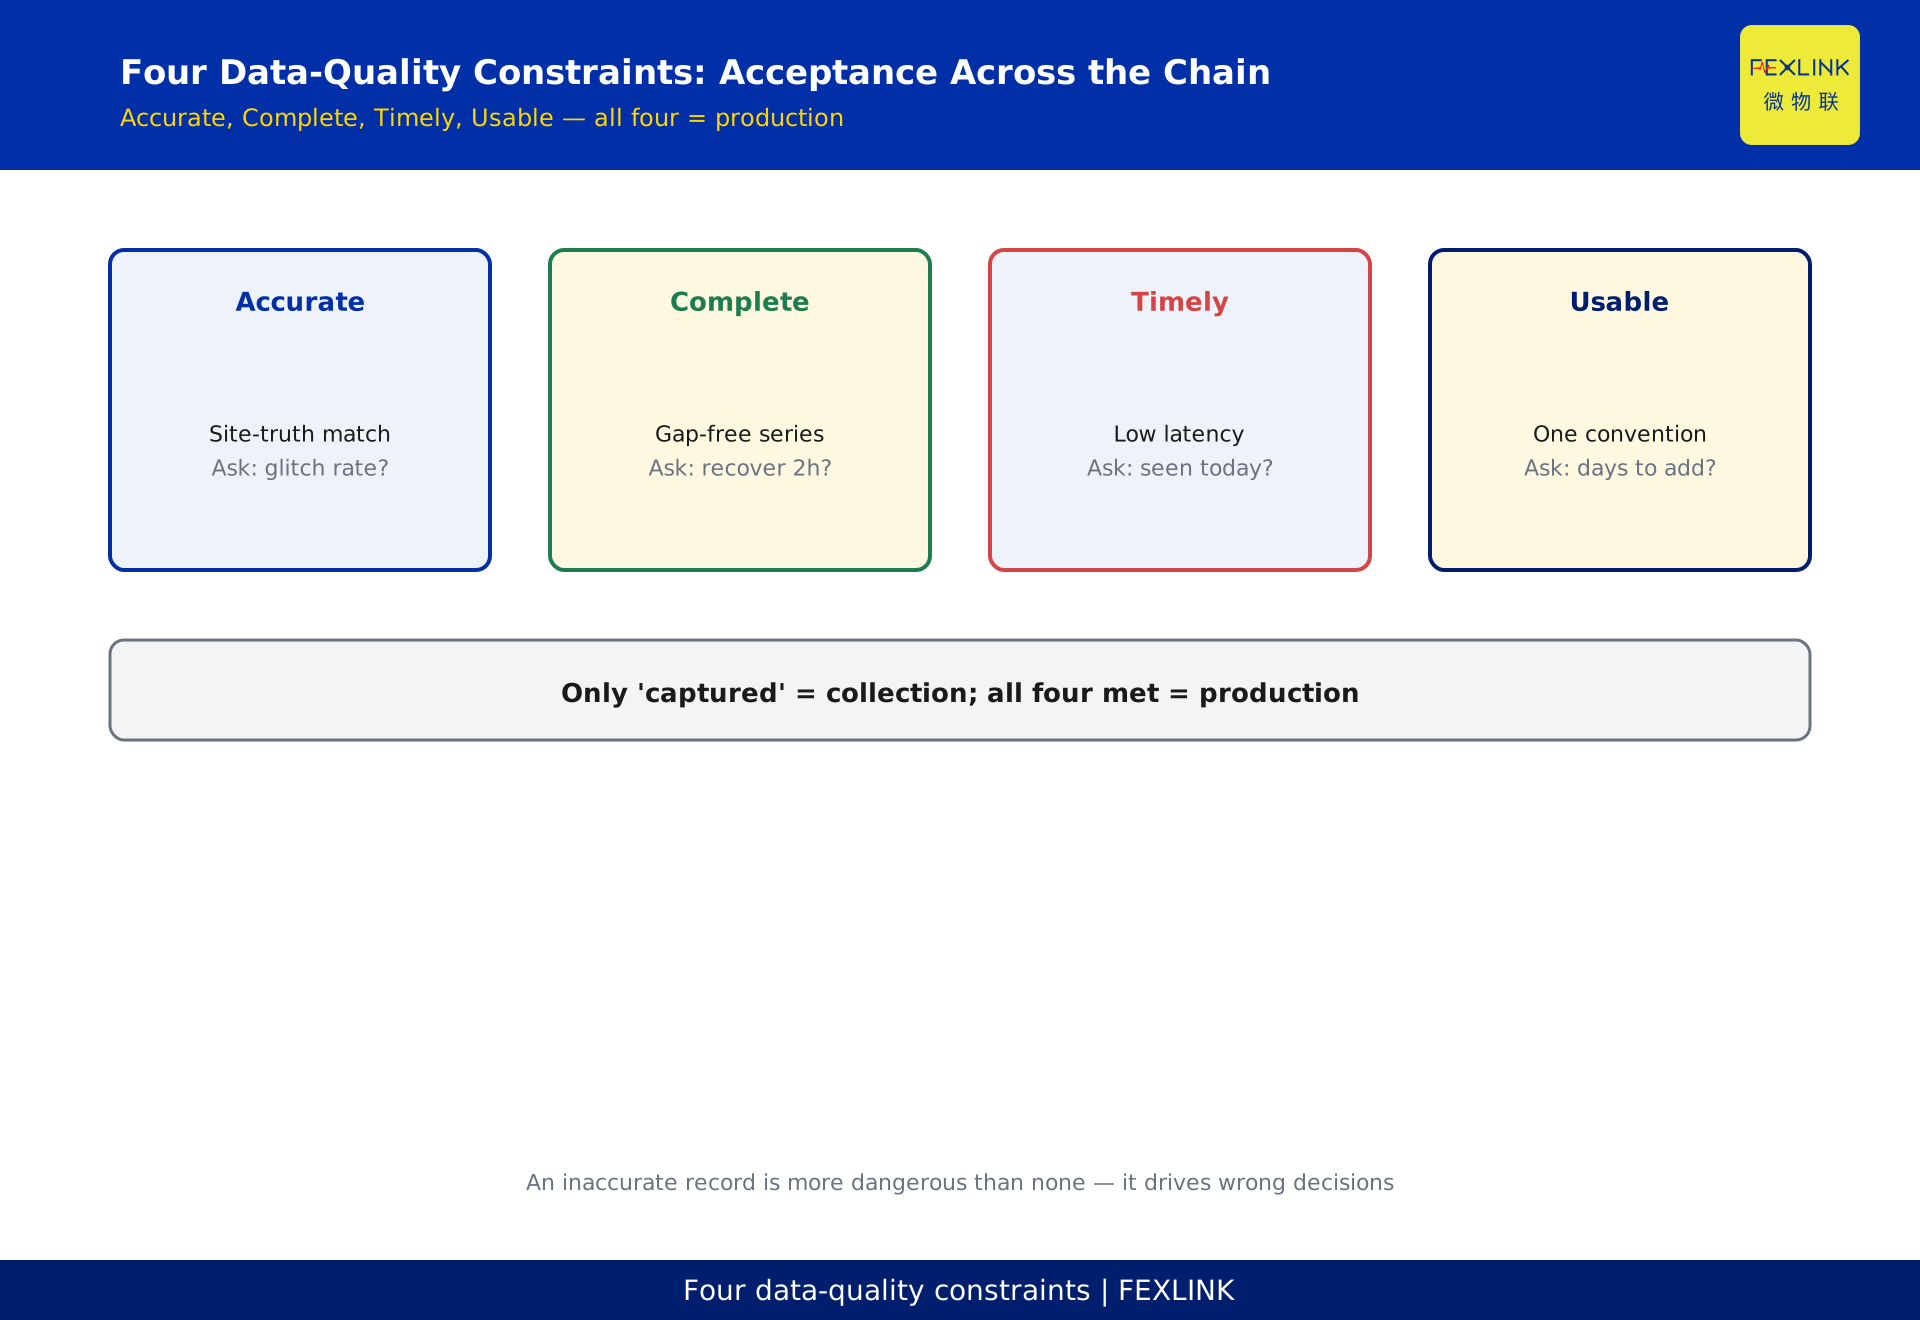
Direct Answer
"Data production" is not about installing a monitoring system; it is about turning electrical signals into decision-grade data through a complete loop of five stages: precise sensing → edge aggregation and cleansing → structured time-series storage → intelligent assessment → decision loopback. If any stage is missing, the data remains "collected" but never "usable." When an enterprise starts electrical digitalization, the first task is not picking a platform — it is auditing which of the five stages already exist. In most enterprises the break is not in sensing but in the two middle-and-last stages: edge cleansing and decision loopback.
1. Why "Data Production" Matters: Collected Is Not Usable
Many enterprises have installed meters and data collectors. Open the platform and you see voltage, current, and temperature curves. Yet when someone asks "which circuit is degrading," "why did this month's energy consumption rise," or "where should tomorrow's maintenance go," the data cannot answer. The problem is not missing data; it is that the data was never "produced."
An electrical signal is raw material; decision-grade data is the finished product. Between the two runs an entire production line: acquisition, cleansing, storage, analysis, and action feedback. Break any stage and no product comes out. Treating data production as a system — rather than buying hardware and features one by one — is closer to the essence of the problem. This article extends the concept introduced in KD-0002 (data production vs. data collection): that piece explained the difference between the two ideas; this piece explains which capabilities you must actually build.
A simple test tells you whether your data has been produced successfully: it can directly support a decision. For example, "plan a maintenance outage tonight at 22:00 on the LV busbar of transformer 3." Supporting that decision requires the busbar temperature trend, the load curve, recent alarm records, and a post-maintenance baseline for comparison. If those facts have to be hunted, assembled, or guessed by hand, the data has not been produced.
2. The Five Stages at a Glance
Each stage has a clear input, capability, and output:
- Stage 1 — Precise sensing: input is the raw electrical signal at site; the capability is choosing the right objects and measurement points and installing the right sensing devices; output is an accurate, complete, and timely raw data stream.
- Stage 2 — Edge aggregation and cleansing: input is raw data from many vendors and protocols; the capability is protocol normalization, edge pre-processing, and store-and-forward; output is clean data with one convention and no dirty samples.
- Stage 3 — Structured time-series storage: input is the clean data stream; the capability is time-series modeling and tiered storage; output is an asset that is traceable for 90 days and queryable in seconds.
- Stage 4 — Intelligent assessment: input is structured data; the capability is multi-parameter joint analysis, trend warning, and graded alarms; output is evidence-based judgment.
- Stage 5 — Decision loopback: input is the assessment conclusion; the capability is turning judgments into maintenance, operations, and energy actions and feeding results back; output is continuous improvement through the loop.
The order cannot be rearranged: sensing before data, cleansing before storage, storage before assessment, assessment before action. Skipping a stage to rush to a platform turns the platform into a data graveyard — which is why many digitalization projects are lively at go-live and silent six months later.
3. Stage 1 — Precise Sensing: What to Measure and How
The most common sensing mistake is measuring everything, or measuring at random. The principle is: decide the decision questions first, then the measurement points.
First, choose objects. Score distribution objects by risk × actionability ÷ cost and start with the highest scores. In practice, begin with four classes: the incoming breaker (entry power and fluctuation baseline), the main busbar (temperature and load distribution), key outgoing circuits (circuit load and harmonics), and the transformer LV side (temperature rise and leakage current).
Second, choose parameters. For voltage: RMS, fluctuation, and three-phase balance. For current: load, starting surge, and harmonic content. For temperature: conductor temperature rise and panel temperature rise. For leakage: microamp-level leakage trend. Parameters are not "the more the better"; each must map to a decision question. If you want to know whether busbar temperature is rising, measure the joint temperature-and-load curve rather than accumulating unrelated parameters.
Third, choose the count. For most enterprises, 10–15 measurement points are enough to see one or two critical switchrooms clearly. Fewer points make it easier to keep the data convention clean. One switchroom done precisely is worth more than ten switchrooms measured with dirty data.
The sensing layer runs on multi-parameter monitoring modules, controllers, and smart meters (for example, the FSA/FSB/FSE controllers and the ZSA/ESA smart meter families in the FEXLINK portfolio). They convert analog electrical signals into structured digital values at the source and hand one consistent convention to the upper layers.
After deployment, one critical step is often skipped: building the baseline. The baseline is a set of "normal values" captured during early operation and normal load variation — the usual busbar temperature range, the usual incoming power factor, the usual harmonic content per circuit. Without a baseline, later assessment has no reference for "how far from normal counts as abnormal," and thresholds are set by guesswork. Baseline collection should cover full operating conditions (workdays and weekends, peak and valley hours) and typically starts with seven days of continuous data. Once the baseline exists, assessment thresholds have an anchor and false alarm rates drop sharply. This step closes out sensing, but it determines the quality ceiling of Stage 4 — it deserves its own line in the project plan.
4. Stage 2 — Edge Aggregation and Cleansing: The Gatekeeper Before the Platform
This is the most underestimated stage and the most common break point. A site often has dozens of devices from different vendors speaking different protocols: Modbus, DL/T 645, and IEC 60870-5-104 each in their own dialect, with different sampling intervals, units, and timestamps. Without cleansing, dirty data enters the platform and biases every downstream assessment.
Edge aggregation and cleansing does four jobs:
- Protocol normalization: unify multi-protocol data at the edge into one internal convention, so the platform faces a single format.
- Quality cleansing: remove spike glitches, duplicate frames, and out-of-range values; mark missing intervals so that dirty data never reaches storage or assessment.
- Edge pre-processing: perform computations that need fast local response at the edge — for example, millisecond-level voltage fluctuation feature extraction — instead of sending data to the cloud and back.
- Store-and-forward: cache data locally during network jitter or outages and re-transmit automatically on recovery, keeping the time series continuous with no gaps.
The core device of this stage is the edge gateway. The FEXLINK ESX intelligent edge computing gateway, for example, handles protocol normalization, edge pre-processing, and store-and-forward; it talks to multiple field buses below and one unified format to the platform above. Selection points: whether the gateway's protocol library covers the site's installed devices, whether its edge computing capacity meets local response requirements, and whether its store-and-forward cache is large enough.
Edge cleansing and platform cleansing must have a clear division of labor. The principle: every quality issue that must be settled before data enters the platform belongs at the edge — protocol format, unit conversion, timestamp alignment, and glitch removal are edge duties; analyses that need cross-object or cross-time-window views belong on the platform — for example, whole-network completeness audits or cross-switchroom comparisons. Pushing protocol conversion to the platform forces it to maintain multiple parsing logics and lets dirty data pollute every application. Overdoing edge cleansing (for example, running site-wide statistics at the edge) overloads the gateway and makes rules hard to manage centrally. The clean boundary: the edge guarantees "every record is correct and one format," and the platform guarantees "the whole set is complete and one convention."
How do you know the stage is working? Three acceptance checks: the platform receives only one convention; the dirty-data ratio is negligible; and after a network outage, historical data is re-transmitted completely.
5. Stage 3 — Structured Time-Series Storage: Making Data Traceable
Cleansed data must enter suitable storage before it becomes an asset. Electrical data is, by nature, a time series: voltage, current, and temperature sequences per measurement point ordered by time. Two storage design decisions matter:
- Time-series modeling: organize data by the "point × time" index, supporting second-level queries and long-range retrospect, instead of dumping rows into ordinary relational tables and querying them hard.
- Tiered storage: hot data (last 7 days) queryable at speed; warm data (last 90 days) traceable; cold data (older) archived at low cost. Not all data needs to be kept at full precision forever.
"Traceability" is the acceptance core of this stage: can you pull up a given circuit's load curve for a specific day 90 days ago within one minute? If yes, the data is an asset. If no, the storage is just "charts occupying a hard disk."
Structured time-series storage typically lives in a time-series database at the platform side, deployed together with a digitalization platform such as the Taiyi smart-control hub. Storage design decisions (retention granularity, compression policy, retention period) should be made at project start, because migrating later is extremely expensive.
6. Stage 4 — Intelligent Assessment: From Numbers to Judgment
Intelligence only earns its place after clean, continuous, traceable data exists. The value of assessment is turning "a curve" into "a judgment": for example, "this circuit's temperature is rising at 0.8°C per day and will cross its limit in about nine days at the current trend."
Assessment must be layered; one model cannot do everything:
- The identify layer answers "which parameter is abnormal" — voltage fluctuation over limit, harmonic content over threshold, leakage current rising steadily — recognized by feature-level models.
- The contextual layer combines the object's location, scenario, and related parameters to answer "why and where it is abnormal." The same high temperature needs different handling for a busbar connection point overheating than for a circuit overload.
- The predictive layer extrapolates from historical trends to answer "when trouble will come" — providing remaining life or warning lead time, moving maintenance from reactive to proactive.
In the FEXLINK AI system, these map to three engines: Qianzhi (50 sub-models) handles the identify layer; Wanxiang combines scenarios and association rules for the contextual layer; Tianyuan (67 predictive models) handles trends and lead time. The three engines cooperate in a chain — the subject of KD-0028. The point for this stage: the input to assessment must be the clean data from the first two stages; otherwise the AI learns dirty patterns.
Assessment output lands as graded alarms: ignorable, needs attention, needs handling, needs immediate handling — each grade with a clear response time and responsible role, instead of pushing every anomaly equally to the duty staff.
Build assessment capabilities in a deliberate order: identify first, contextual second, predictive third. The identify layer needs the simplest data and shows results fastest — usually within two weeks of a clean data stream. The contextual layer needs scenario rules and an equipment register, so it is step two. The predictive layer depends on historical accumulation (at least 90 days of continuous data is recommended), so it goes last. Built in this order, each layer stacks on the data and rules of the previous one, and you never face the dilemma of "a strong model with nothing to feed it."
7. Stage 5 — Decision Loopback: From Judgment to Action
The final purpose of data production is turning judgments into actions and verifying the effect. This stage upgrades "seeing problems" to "solving problems":
- Maintenance loop: assessment says "a circuit's temperature keeps rising" → the issue enters the maintenance plan → after maintenance, compare the temperature-rise curve to verify recovery.
- Operations loop: graded alarms auto-create work orders, track handling status, and accumulate handling experience into reusable knowledge.
- Energy loop: abnormal energy analysis → linked energy-saving actions (peak shifting, voltage regulation, start-stop optimization) → verify savings with before/after energy comparison.
- Safety loop: multi-parameter joint assessment of leakage, harmonics, and temperature → trigger local protection actions or manual handling → review the event and refine thresholds and rules.
One marker tells you whether the decision loop is working: are alarms and work orders on the platform decreasing? If the alarm count never changes year after year, the loop has not really flowed back — handling experience is not feeding the assessment rules, and thresholds are not adjusted against actual false-alarm rates. The loop is a continuous cycle of "data → judgment → action → new data"; each turn should make the system more accurate than the last.
In FEXLINK deployments, the digital electrical intelligent supervision system carries the decision loop: assessment conclusions enter work orders and maintenance workflows, local protection devices are triggered, and handling results are written back as tuning inputs for the assessment rules.
Build the loop starting from "one switchroom, one circuit type" rather than rolling out the whole site at once. Take busbar temperature rise as the pilot scenario: temperature anomaly → graded assessment → maintenance recommendation → post-maintenance temperature-curve comparison verifies recovery. Run that one chain until it is trusted, then replicate to harmonics and leakage scenarios, then extend site-wide. Two reasons: first, the loop involves organizational process (who handles work orders, who reviews rule tuning), and a small pilot keeps process磨合 costs low; second, the loop's value must be proven with data (alarm reduction rate, maintenance timeliness), and a single-scenario dataset is cleaner and easier to quantify — which in turn convinces management to fund expansion. The common cause of failed projects is attempting the whole-site loop in one step: processes unproven, effects unverified, and the system quietly retired six months later.
8. The Four Data-Quality Constraints: Accurate, Complete, Timely, Usable
Whether the five stages hold depends on four quality constraints that run through the whole chain and serve as acceptance criteria:
- Accurate: data matches the true value at site — requiring correct range configuration, proper calibration, and edge cleansing that removes glitches. An inaccurate record is more dangerous than no record, because it drives wrong decisions.
- Complete: the time series is continuous with no gaps — requiring store-and-forward and integrity checks; critical windows (for example, the 30 minutes before a fault) must be complete.
- Timely: the latency from acquisition to query meets decision needs — second-level visibility for monitoring, minute-level delivery for warnings, millisecond-level response for actuation.
- Usable: formats, units, and conventions are unified so that upper-layer algorithms and business systems can consume data without special handling.
These four constraints are the dividing line between "production" and "collection." Collection only satisfies "data is captured"; production satisfies all four. In a self-audit, score each constraint: Accurate — what was the latest glitch-removal rate? Complete — can two hours of data lost in an outage be recovered? Timely — did last night's alarm surface only today? Usable — how many days does it take to connect a new system to the platform?
9. A Self-Audit Blueprint: Which Stage Is Missing
Draw the five stages as a checklist and mark each in order:
- Sensing: do the incoming breaker, busbar, and key circuits of the critical switchrooms have measurement points? Is the count restrained (10–15 to start)?
- Aggregation and cleansing: is multi-protocol site data normalized at the edge? Is dirty data removed before the platform?
- Storage: is data modeled as time series and traceable for 90 days? Does second-level query work?
- Assessment: is there layered identify–context–predictive assessment? Are alarms graded and assigned to roles?
- Loopback: do assessment conclusions enter maintenance/operations/energy actions? Is the effect verified after handling?
The audit pattern is typical: most enterprises partially have stages 1 and 3; stage 2 is often vague (a gateway exists but quality cleansing does not); stage 4 stops at "alarm push" rather than layered assessment; stage 5 is mostly missing. The further back the break lies, the more value is lost. Spending 30% of the budget on sensing while a missing loopback leaves 100% of the data with no decision value is the least economical waste of all.
If the audit finds a missing stage, fix that stage rather than tearing down and rebuilding: with sensing in place, add edge cleansing; with storage in place, add assessment and loopback. Every step makes existing investment produce incremental value.
Scope and Limitations
The "five-stage data production" framework in this article is a methodology for planning and self-auditing enterprise electrical digitalization; it is not a project implementation plan. The FEXLINK product capabilities mentioned (FSA/FSB/FSE controllers, ZSA/ESA smart meters, the ESX intelligent edge computing gateway, the Taiyi smart-control hub, the Qianzhi/Wanxiang/Tianyuan engines, and the digital electrical intelligent supervision system) come from the FEXLINK product knowledge base as product-documentation conventions. Figures such as "10–15 measurement points," "90-day traceability," and "0.8°C/day rise" are illustrative; actual values depend on site conditions, equipment state, and project objectives. All example scenarios (an industrial park, a factory, an airport) are anonymized and do not refer to any specific customer. Selection and implementation should be assessed on site by qualified professional teams.