 微物联研究院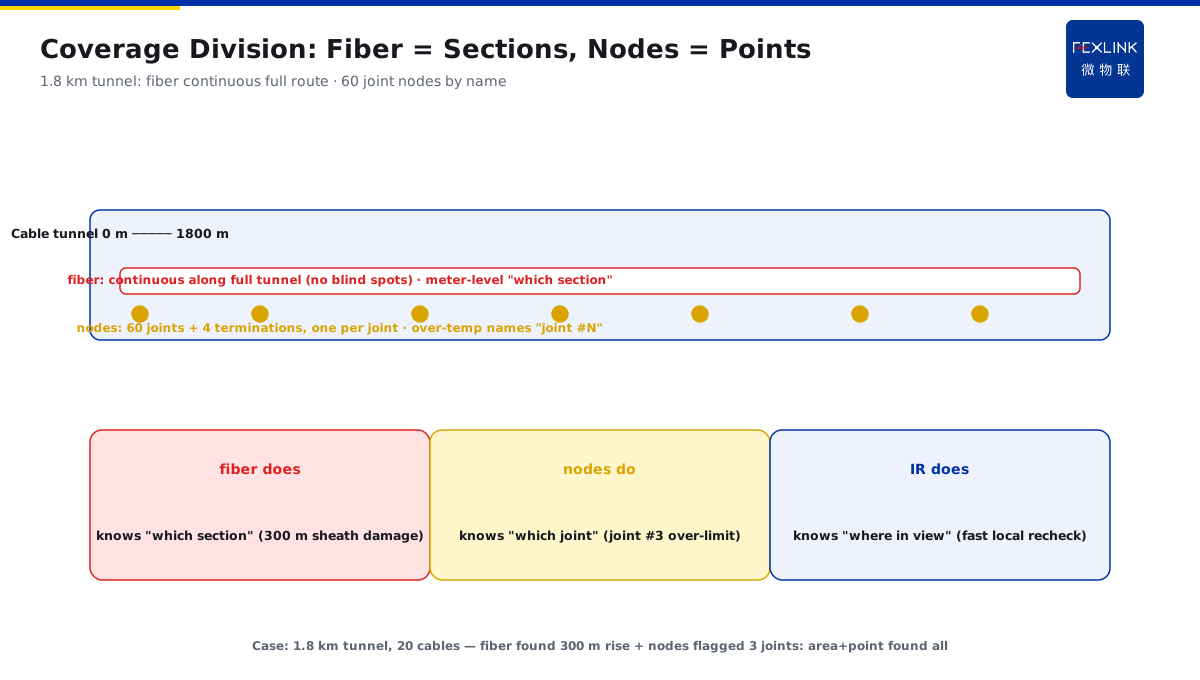
Direct Answer
A cable tunnel needs temperature monitoring — how do you choose among distributed fiber, wireless sensing nodes, and online infrared? The answer: assign by monitoring target — distributed fiber suits long distances and continuous along-tunnel coverage with meter-level localization; wireless nodes suit discrete critical points like cable joints and terminations at low cost; online infrared suits local observation within view. Real projects usually combine "fiber for the full route, nodes guarding the key joints" rather than picking one.
At a campus, a 1.8 km cable tunnel carried 20 10 kV cables with a limited budget; the vendor offered two quotes: full-fiber (expensive) or all-nodes (feared to under-cover). Decomposed by target: the full tunnel needs to know "which section is overheating" — that is fiber's job (continuous along-tunnel sensing, meter-level localization); the 20 cables had 60 mid-joints and 4 terminations, and joints are the most overheating-prone points — that is the nodes' job (one wireless node per joint, low cost, direct data transmission). Final combination: 1.8 km fiber (host + sensing cable) for "area coverage," wireless nodes (EST Multi-Channel Temperature Controller with wireless LoRa sensing) on all 60 joints + 4 terminations for "point guarding." Within a year, fiber found a local temperature rise at 300 m from a damaged outer sheath, and nodes flagged over-temperature early at 3 joints — area + point together, every fault was findable.
Because:
- The monitoring target decides the technology: continuous full route → fiber; discrete critical points → wireless nodes; local view → infrared;
- Localization is the dividing line: fiber localizes along the route (which section), nodes report point-by-point (which joint), infrared only sees "within view";
- Cost scales by distance and point count: fiber cost grows with length but per-km cost is controllable; node cost grows with point count and is cheaper when points are few;
- Combination is the norm: "fiber for the full route, nodes guarding joints" — area coverage + point guarding balances coverage and cost.
Key insight: cable temperature monitoring is not "pick one technology"; it is "assign tasks by target." The full route goes to fiber, joints to nodes — each using its strength, full coverage at controlled cost.
At a port, a cable-duct tunnel first deployed fiber only, but joint over-temperature still required manual patrols to confirm. Review: fiber localizes to the meter level, but joints are discrete and need fast identification of "which exact joint" — after adding wireless nodes to all 24 joints, over-temperature named the joint number directly and patrol targets became clear. Fiber answers "which section"; nodes answer "which joint" — each answers its own question.
1. How the Three Technologies Measure Temperature
First clarify how each technology measures:
1. Distributed fiber-optic sensing (DTS):
- Principle: a laser travels the sensing cable; Raman-scatter signals vary with temperature and are demodulated point by point along the route;
- Monitors: continuous temperature along the cable (full tunnel, full tray route);
- Localization: meter-level (which section is hot);
- Characteristic: one cable measures the whole route — no gaps, no blind spots; suited to long continuous monitoring.
2. Wireless sensing nodes (LoRa/RF):
- Principle: contact temperature sensors mounted at joints, terminations, and other critical points transmit wirelessly;
- Monitors: discrete critical points (joints, terminations, mid-joints);
- Localization: exact by point (which joint is hot);
- Characteristic: precise point accuracy, low cost, direct data to the platform — suited to guarding critical points.
3. Online infrared (thermal imaging):
- Principle: an IR camera images the temperature distribution in view;
- Monitors: local areas in view (inside panels, open sections);
- Localization: within the image (where in view is hot);
- Characteristic: non-contact, sees an "area," but limited by view; not suited to long tunnels.
Comparison conclusion:
- Continuous full route → fiber (no blind spots);
- Discrete critical points → nodes (precise + cheap);
- Local view → infrared (supplementary);
- The three are a division of labor, not competitors.
Key insight: the principle decides the application. Continuous or discrete, full route or local — decide the monitoring target first, and the technology route follows.
2. Spatial Coverage and Localization Accuracy
Second question: how far can it cover, and how precisely can it localize?
Spatial coverage:
- Fiber: continuous along the route; a single sensing cable reaches kilometers; full tunnel/tray coverage with no blind spots;
- Nodes: point coverage — only where sensors are mounted; the middle has no awareness;
- Infrared: view coverage — one camera covers an angular range; long distances need many cameras.
Localization accuracy:
- Fiber: meter-level — knows "which section" is hot (e.g., at 300 m);
- Nodes: point-level — knows "which joint" is hot (e.g., joint #3);
- Infrared: image-level — knows "where in the image" is hot (depends on camera position).
Engineering meaning of coverage × localization:
- Need "no blind spots over the full route": fiber;
- Need "exact naming of critical points": nodes;
- Need "fast local inspection": infrared;
- Combined: fiber manages "sections," nodes manage "points," infrared manages "local views" — coverage and localization complement.
Key insight: coverage answers "is anything missed," localization answers "can it be pinpointed." For long-route coverage choose fiber; for critical-point naming choose nodes — each is irreplaceable.
3. Prioritizing Joints, Terminations, and Other Critical Points
Where is cable hottest? Not the cable body — joints and terminations:
Critical-point priority:
- Mid-joints: made on site, process variance is large, the most overheating-prone — must-have;
- Cable terminations: concentrated electric field, high moisture risk — must-have;
- Bends/stressed sections: mechanical stress damages insulation — case-dependent;
- Cable body: along-route rise covered by fiber (if present) or spot checks.
Why joints are the focus:
- Joints are "on-site craft" products with large quality variance;
- Joints have higher contact resistance and poorer heat dissipation — hotter at the same current;
- Joint overheating → accelerated insulation aging → breakdown; a significant share of cable faults.
Configuration principles:
- One wireless node per mid-joint (point to point);
- Nodes at terminations (or linked with switchgear temperature sensing);
- Node data feeds the platform; joint temperature trends tracked independently.
Key insight: "joints first" is the default configuration for cable monitoring. When money cannot cover everything, guard the joints — the highest-probability fault locations.
4. Cost Magnitude and Applicable Distance
Selection must face money: how do the three technologies cost out?
Cost structure:
- Fiber: host (the interrogator) + sensing cable (by length) — one-time investment; cost grows with distance but per-km cost amortizes;
- Nodes: sensor unit price × point count + receiving gateway — cost scales linearly with points; cheap when points are few;
- Infrared: camera unit price × count — high per unit; long distances need many, so cost rises fast with distance.
Cost magnitude (engineering reference):
- Short distance (<500 m) + few joints: node solution saves (no fiber host);
- Long distance (>1 km) full-route monitoring: fiber pays (one cable covers the route);
- Many joints (tens): node cost rises clearly; combine with fiber to amortize.
Optimal cost × coverage:
- Long tunnel: fiber for the route (coverage), nodes guarding joints (naming);
- Short duct/local area: all nodes suffice (few points, short distance);
- Open switchgear/panel: infrared supplements local observation.
Key insight: cost is computed by "distance × point count," not by comparing quotes. Fiber's cost is in the host; nodes' cost is in the point count — long routes take fiber, short routes take nodes, many joints take a combination.
5. Typical Combination Patterns
Real projects' mainstream is combination, not single choice:
Pattern 1: fiber full route + nodes guarding joints (long tunnel):
- Fiber: continuous full-route sensing (no blind spots);
- Nodes: all mid-joints + terminations (naming);
- Result: area coverage + point guarding; faults localized to "section + point."
Pattern 2: all nodes (short duct/cable trench):
- Short distance, concentrated joints: all critical points get nodes;
- Result: covers all high-risk points at the lowest cost.
Pattern 3: fiber full route + infrared local (tray/open sections):
- Fiber: full-route rise;
- Infrared: fast scan of suspicious/open sections;
- Result: long-distance monitoring + fast local recheck.
Combination decision logic:
- First list the monitoring targets (full route? joints? local?);
- Then map technologies (fiber/nodes/infrared);
- Finally compute cost by distance × points, cutting low-value parts.
Key insight: "fiber for the full route, nodes guarding joints" is the default combination for long-distance cable monitoring. Not either/or — assign by target, coverage and cost both optimal.
6. Product Landing: An Area + Point Sensing System
FEXLINK's Busbar Monitoring System (FEXLINK-BMS) and EST Multi-Channel Temperature Controller turn the "area + point" combination into practice:
- Fiber sensing: sensing cable laid along the full route, continuous along-route measurement, meter-level localization; temperature curves on the platform;
- EST Multi-Channel Temperature Controller (wireless LoRa sensing): wireless nodes at joints/terminations, direct data, joint-named alerts;
- The platform shows fiber full-route curves and node point values on one screen;
- Alert linkage: "which section is over-limit" (fiber) and "which joint is over-limit" (node) — localization reaches the patrol order directly;
- Connected to the Digital Electrical Intelligent Supervision System, cable temperature, health, and work orders share one dashboard.
Design principle in one sentence: turn "which sensing technology" into "assign the right sensing to each target." Fiber for the route, nodes for joints — each using its strength, one platform managing all.
7. Common On-Site Mistakes
- Comparing quotes, not targets: fiber too expensive → all nodes, or nodes too expensive → all fiber. Consequence: under-coverage or waste. Correct: list the targets (route/joints/local) first, then map technologies.
- Expecting fiber to "name joints": fiber localizes to the meter, but "which exact joint" needs nodes. Consequence: manual confirmation after alarms. Correct: nodes on joints, direct naming.
- Missing joints to save money: joint over-temperature left to patrols. Consequence: the highest-risk area is unguarded. Correct: joints/terminations must-have; others can wait.
- Forcing fiber on short routes: a 500 m duct also gets a fiber host. Consequence: host cost dominates. Correct: all-nodes for short routes.
- Data not reaching the platform: fiber and nodes on separate software. Consequence: two data silos; localization unusable. Correct: unified platform integration, sections + points on one screen.
Scope and Limitations
This article discusses selecting and combining three cable temperature-monitoring technologies (distributed fiber, wireless nodes, online infrared) for cable tunnels, ducts, trays, and trenches. Cost magnitudes are engineering experience references; actual figures follow vendor proposals and site laying conditions. Fiber localization accuracy depends on laying method; node counts must be verified against on-site joint statistics. A combination needs unified platform integration to form a monitoring loop. All cases are anonymized (a certain campus / port) and do not refer to any specific customer.