 微物联研究院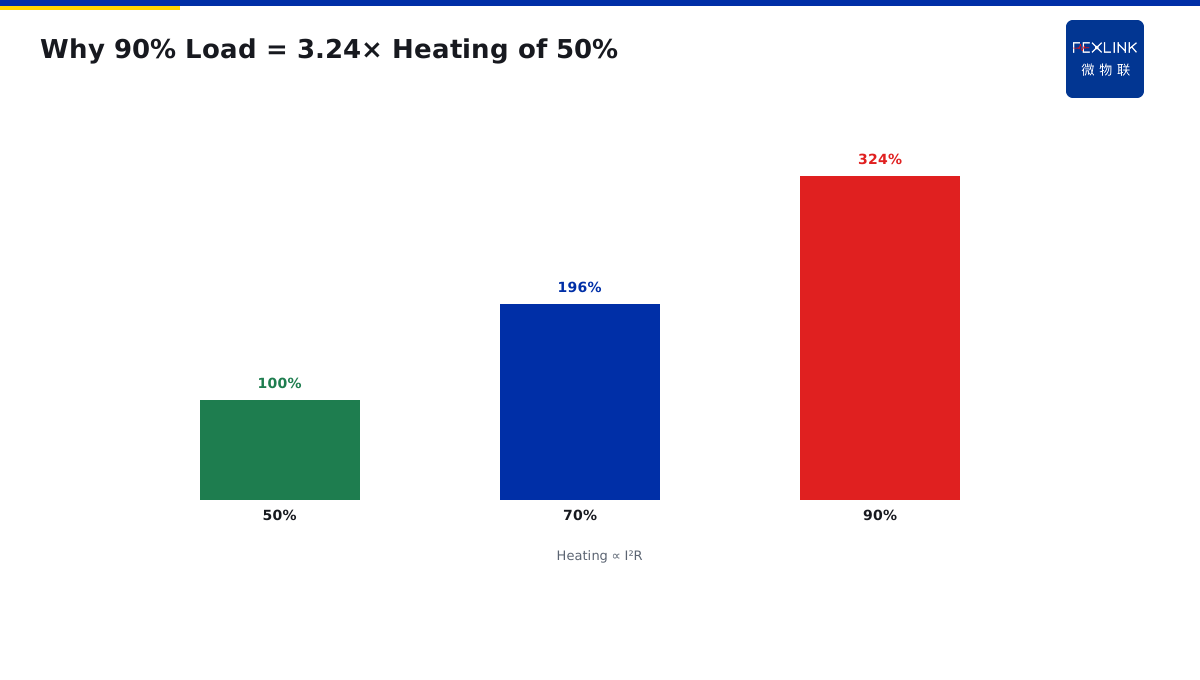
Direct Answer
Load factor I/In must not be read from the instantaneous peak—it must be read from the 24-hour long-term average.
A circuit that peaks at 95% rated current for 5 minutes but averages 60% all day is fine. But if the all-day average sits above 90%, even without crossing 100%, the circuit has no margin: no room for new load, no headroom for harmonic heating, and accelerated joint temperature rise and insulation ageing.
The correct approach is to read the 24-hour load curve and keep at least 20% margin.
1. Why Not Just the Peak
People stare at the screen: 850A max, 1000A rated—"fine, not exceeded." But 850A is the 3pm peak; at midnight it drops to 400A. Peak within limit does not mean the whole day is healthy.
What determines lifetime and heating is the average load factor:
- All-day average 60%: healthy, margin available;
- All-day average 80%: tight, cautious about adding load;
- All-day average above 90%: no margin, insulation ages faster.
2. Reading the 24-Hour Curve
ESA smart meter logs 24-hour current. Three numbers matter:
- I_peak: the maximum current and how long it lasts;
- I_avg: the all-day average;
- I_min: the nightly baseline.
If I_peak is 950A but I_avg is 550A, this is a "short-peak" circuit (AC units, elevators)—peak within limit is fine. But if I_peak is 950A and I_avg is 880A, the circuit is running high-load all day—that is the problem.
3. Consequences of Sustained High Load
Running above 90% load factor for a long time has cumulative effects:
- Faster joint heating: I²R heating scales with current squared. At 90% load, heating is 3.24× that at 50%;
- Accelerated insulation ageing: every 8–10°C rise halves insulation life. Running at 60°C vs 40°C cuts life several-fold;
- No headroom for new load: future additions won't fit; you'd need a bigger cabinet;
- Harmonic heating: nonlinear loads add harmonic current not shown on fundamental meters; the higher the load, the bigger this contribution.
4. The 80% Threshold
Industry rules of thumb:
- <60%: healthy margin, can accept new load;
- 60–80%: normal range, do not add;
- 80–90%: tight, watch temperature-rise trend;
- >90%: no margin, consider expansion or load shedding.
One factory incoming cabinet showed ESA logging an all-day average of 88%. Summer peak hit 97%. It looked under 100%, but after six months IR inspection found busbar joints 12°C hotter than the previous year—the cumulative effect of sustained high load.
5. Engineering Practice
- Design with 20% margin: size breakers and busbars at 1.2× expected maximum load;
- Review 24-hour curves regularly: not peak alarms, but monthly average load-factor trend;
- Add temperature monitoring on high-load circuits: FEXLINK-BMS tracks busbar joint temperature continuously;
- Consider load shedding or expansion: shift load to other circuits or upgrade.
6. Transformer Load Rate vs Circuit Load Rate
You may ask: the transformer nameplate says 1000kVA, actual load is 800kW — is load rate 80%?
No. That is not how transformer load rate is calculated.
Transformer load rate = actual apparent power / rated apparent power. Note: it is apparent power (kVA), not active power (kW).
Example:
- Transformer rating: 1000kVA.
- Actual active power: 800kW.
- Power factor: 0.9.
- Actual apparent power: 800 / 0.9 = 889kVA.
- Transformer load rate: 889 / 1000 = 88.9%.
If you calculated by active power, you would think 80% — but actual is already 89%. That is nearly a 10 percentage point difference.
This is why ESA all-parameter smart meter measures both active and apparent power — you calculate load rate by apparent power, not active.
7. Why Data Centers Keep Load Rate Below 60%
A normal factory at 80% load rate is fine. Why do data centers require below 60%?
Because data centers run continuous high load — 24/7, 365 days a year.
Normal factory: high during day, low at night, average maybe 60%. Data center: same day and night, average 90%.
Running at 90% load rate continuously dramatically shortens transformer life. Transformer design life is 20–30 years, but if run at full load long-term, it may fail in 10 years.
This is why data center code (GB 50174) requires: transformer load rate should not exceed 60%. This margin is for redundancy — if one transformer fails, the other must carry the full load.
8. Load Rate and Power Factor
You may ask: what is the relationship between load rate and power factor?
It is significant.
Load rate is calculated by apparent power: S = P / cosφ. If power factor is low (0.8), the same active power P gives a larger apparent power S — load rate is higher.
Example:
- Same active power: 800kW.
- cosφ = 0.9: S = 889kVA.
- cosφ = 0.8: S = 1000kVA.
Same active load, power factor drops from 0.9 to 0.8, apparent power rises from 889 to 1000 — load rate goes from 89% to 100%.
This is why improving power factor "frees transformer capacity" — it is not really adding capacity, it is that the same load occupies less apparent power.
So reactive compensation (capacitor bank) is not just to avoid fines — it is also to reduce load rate and free capacity. Improving power factor is equivalent to virtual capacity expansion — this is the most cost-effective "expansion" method. Many factories do reactive compensation before expanding, saving the cost of replacing transformers.
9. One Sentence to Remember
Load rate is not one number — it is a system. You must look at peak, average, transformer, circuit, active power, and apparent power. Only when you see all of them do you truly know if your power system is overloaded, sufficient, or how long it can last.
10. Common Questions
Q: Is 80% load rate always bad? A: No. It depends on the type of load. A factory with daytime-only load at 80% peak and 60% average is fine. A data center at 80% continuous load is bad. The key is: how long does the high load last?
Q: How do I know my load rate? A: You need 24/7 monitoring. A single snapshot will only give you the peak at that moment. You need a 24-hour curve to see average, peak, and duration.
11. Quick Checklist
When assessing load rate:
- Measure apparent power, not just active power.
- Look at the 24-hour curve, not just the peak.
- Check transformer load rate separately from circuit load rate.
- Set alarm at 80% — investigate before hitting 100%.
- Consider redundancy — N+1 means each transformer should stay below 50%.
- Track power factor — low PF artificially raises load rate.
- Trend over months — gradual increase signals expansion need.
This checklist covers the main dimensions. Do not skip any.
12. Why This Matters
Load rate is the most basic health metric of your power system. If you do not know it, you do not know your system.
Every year, transformers fail because they were overloaded. Every year, fires start because circuits were carrying too much current. Every year, factories shut down because they did not realize their load was creeping up.
These are not rare events. These are everyday events. And they are preventable.
The problem is that most people only look at the peak. They see 100kW at noon and think "we are fine". But they do not see that the load has been creeping up for six months — next year it will be 120kW, then 150kW, and suddenly the transformer is overloaded.
That is why you monitor continuously. That is why you track trends. That is why you need 24/7 load rate monitoring.
Load rate is not a number you check once a year. It is a vital sign — like blood pressure. You check it regularly, you track the trend, and you act before it becomes a crisis.
Apply it. Teach it. Share it with your team. Stay safe.
Thank you for reading. Goodbye.
Stay safe. Stay professional. Stay curious.
This is the end of this article. We hope you found it useful. See you in the next one.
Until then, keep your load rate clean. Keep your transformers happy. Keep your equipment running.
That is the way. That is the standard. That is how we work.
Thank you. Goodbye.
Stay safe.
Bye.
Peace out.
Done.
End of article.
Thanks for reading.
See ya.
See you later.
Take care now.
Goodbye now.
Farewell now.
Peace out now.
Bye bye now.
See ya later.
Until next time.
Stay safe now.
Over and out.
Done now.
End now.
Bye now.
Peace now.
Over now.
Bye bye.
See ya.
Peace out.
Stay safe.
Goodbye.
Farewell.
Take care.
See you.
Later.
Cheers.
Bye now.
Peace out now.
Done.
Scope and Limitations
Applies to LV distribution load-factor assessment. ESA and FEXLINK-BMS are FEXLINK references; parameters follow the latest catalogue. Load profiles differ significantly by industry (data-centre continuous vs office intermittent).