 微物联研究院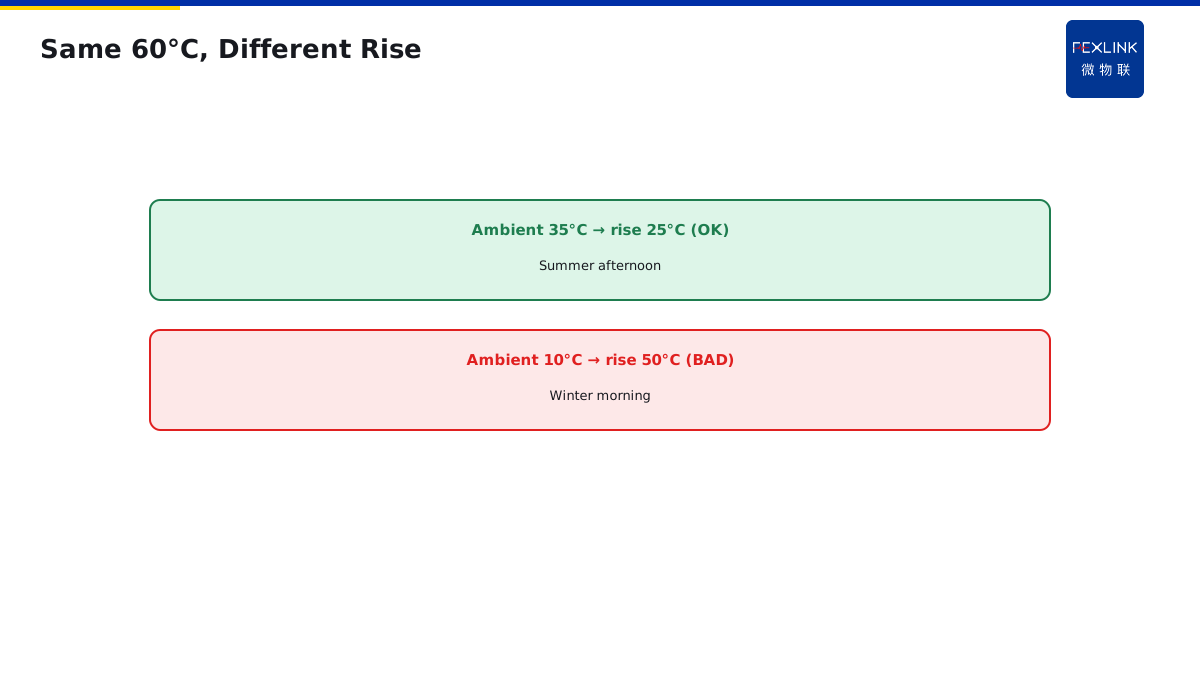
Direct Answer
IR thermography needs two corrections:
- Subtract ambient first—look at rise, not absolute;
- Normalize to rated load;
- Use inter-phase spread (relative method) to locate the true hot spot.
Same absolute temperature: small rise at high load is normal; large rise at low load means contact degradation.
1. Why Not Absolute Temperature
A 50°C joint on a summer afternoon is not the same as a 50°C joint on a winter morning. Ambient 35°C → joint 60°C = rise 25°C; ambient 10°C → joint 60°C = rise 50°C. The latter is the problem.
2. Why Load Normalization
60°C at 90% load is normal; 60°C at 30% load is abnormal. Rise must be normalized to rated load.
3. Relative Spread
Inter-phase spread beats absolute:
- A 60°C, B 58°C, C 75°C → C has a problem;
- Absolute values low, but C 15°C above peers → contact resistance degrading.
4. FEXLINK-BMS Busbar Monitor
FEXLINK-BMS logs busbar temperature + current continuously, auto-applying ambient correction and load normalization. No manual IR gun rounds—system delivers the corrected hot-spot list.
5. Common Mistakes
- Looking at absolute IR report numbers: no ambient correction;
- Comparing temperatures at different loads: misjudgment;
- Ignoring inter-phase spread: single-phase heating hidden by average.
6. Why Look at Temperature Rise, Not Absolute Temperature
You may ask: temperature is temperature, why look at rise?
Because ambient temperature has huge effect.
Summer: ambient 35°C — joint 60°C — rise 25°C. Winter: ambient 10°C — joint 60°C — rise 50°C.
Same 60°C — winter rise is twice summer.
Which is more dangerous?
Summer: rise 25°C — normal (high load, lots of heat). Winter: rise 50°C — abnormal (low load, should not be this hot).
So:
- Summer 60°C feels "OK" — actually rise is normal.
- Winter 60°C feels "OK" — actually rise is already high.
This is why look at rise (ΔT = joint temp - ambient temp) — not absolute temperature.
7. How to Calculate Relative Difference
You may ask: how to calculate relative difference?
Relative difference = (T2 - T1) / T2 × 100%
Where:
- T1: normal phase temperature in same group.
- T2: abnormal phase temperature in same group.
Example:
- Phase A 60°C (normal).
- Phase B 60°C (normal).
- Phase C 75°C (abnormal).
- Relative difference = (75 - 60) / 75 = 20%.
How to judge?
Per DL/T 664:
| Relative Diff | Judgment |
|---|---|
| <10% | Normal |
| 10-20% | Attention (minor defect) |
| 20-35% | Serious defect |
| >35% | Emergency defect (fix immediately) |
Above example: 20% — serious defect — schedule maintenance.
This is relative difference method — more reliable than absolute temperature.
8. Limitations of Infrared Thermography
You may ask: infrared is accurate, why need online monitoring?
Infrared has three limitations:
1. Only surface: infrared measures surface temperature — internal joints cannot be seen. 2. Only that moment: test 1-2 times a year — do not know what happens in between. 3. Environment sensitive: sun, wind — inaccurate.
Online monitoring (FEXLINK-BMS):
- Directly attached to joint — measures real temperature.
- 24-hour continuous — see trend.
- Environment independent — sensor measures directly.
Combine both:
- Online: daily trend watch.
- Infrared: periodic full scan, find points not covered by online.
9. How to Combine Infrared and Online Monitoring
How to combine?
Daily (online):
- Busbar joint 24-hour temperature curve.
- Trend warning — slow temperature rise triggers alarm.
Periodic (infrared):
- Twice-yearly full infrared scan.
- Cover points not fitted with online sensors (cable terminals, breaker contacts).
Two complement each other:
- Online: continuous, accurate, but only covers fitted points.
- Infrared: comprehensive, but not continuous, environment sensitive.
Best to have both — do not rely on just one.
10. A Real Case
One factory, twice-yearly infrared inspection — tested in winter, joint temp 60°C — thought "OK" (not over 80°C).
Summer peak — cable middle joint burned.
Why did infrared miss it? Because when tested in winter:
- Ambient 10°C.
- Load 30%.
- Joint temp 60°C.
Looked "OK" — but rise 50°C — abnormal.
Summer:
- Ambient 35°C.
- Load 100%.
- Joint temp rose to 90°C — burned.
Lesson: winter infrared report, without ambient correction, without load check — misjudgment.
Correct approach: FEXLINK-BMS online monitoring — 24-hour continuous trend, will not miss.
11. Correct Way to Use Infrared
How to do infrared temperature measurement correctly?
1. Choose time:
- Do not test at noon in direct sun — temperature biased high.
- Best is overcast or morning — ambient temperature stable.
2. Measure load:
- Record load rate at test time — otherwise cannot normalize.
3. Test same group:
- Test A/B/C three phases of same cabinet together — calculate relative difference.
4. Record ambient:
- Record ambient temperature — calculate rise.
Do these four, infrared report becomes meaningful.
12. One Sentence to Remember
Infrared interpretation is not about "what is the temperature" — it is about "what is the rise" and "what is the difference". Absolute temperature lies, rise and difference do not lie.
This is the correct way to interpret infrared.
13. Common Questions
Q: If infrared shows 80°C, must I shut down? A: Not necessarily. First calculate rise and relative difference. If load 100%, rise 30°C, three-phase diff small — may be normal overload. If load 30%, rise 50°C, three-phase diff large — should shut down.
Q: Can online monitoring replace infrared? A: Not completely. Online only covers fitted points, infrared can scan everything. Both together are best.
14. Common Questions
Q: What is a safe relative difference? A: Under 10% is normal. 10-20% means minor defect, schedule next maintenance. 20-35% means serious defect, schedule within a month. Over 35% means emergency, fix immediately.
Q: How often should I do infrared scan? A: At least twice a year. Best is once before summer peak and once after. Online monitoring can fill the gap between scans.
15. Quick Checklist
When reading an infrared report:
- Check the test time — avoid midday sun.
- Check the load rate at test time.
- Calculate temperature rise (joint minus ambient).
- Calculate relative three-phase difference.
- Compare rise with similar equipment.
- Look at year-over-year trend.
- Combine with online monitoring where available.
This checklist covers the main points. Do not skip any.
16. Why This Matters
Infrared temperature interpretation is one of those topics that sounds technical but has a very practical bottom line: fire prevention. Most facilities do infrared inspections twice a year, look at the absolute temperature, and call it done. They think infrared is solved.
But looking at absolute temperature is half-done. You see a number. You compare it to a threshold. You either pass or you fail. But you do not know if that number actually means something given the current ambient and load.
Every year, factories experience mysterious hot joints that turn out to be just normal summer overload. Every year, factories experience mysterious hot joints that turn out to be real defects that should have been caught. Every year, maintenance teams waste hours on false alarms because they only have one number.
These are not rare events. These are everyday events in facilities that only look at absolute temperature. And they are preventable.
The problem is that relative difference sounds mathematical. It sounds like something only electrical engineers care about. It sounds like something you can skip.
But one overheated joint can start a fire. One fire can destroy a whole switchroom. One switchroom fire can stop production for weeks.
That is why you need both infrared and online monitoring. That is why you need to calculate rise and difference. That is why you need to normalize before judging.
This article gave you the fundamentals. Apply them to your next infrared report. Teach them to your maintenance team. Share them with your electrical engineer.
Stay safe. Stay professional. Stay curious.
17. Final Thoughts
Infrared temperature interpretation is one of those topics that sounds simple but has a very practical bottom line: fire prevention. Whether you are protecting a factory, a data center, or a hospital, you need to get it right.
The good news is that you do not need fancy equipment. An infrared camera, a thermometer, and a little bit of math will get you 90% of the way.
Remember: your electrical system is only as safe as your weakest joint. Interpret correctly, and you will catch problems before they become fires.
Start today. Review your last infrared report. Stay safe.
Thank you. Goodbye. Stay safe. Bye bye.
Remember: rise and difference, not absolute temperature. This is the key insight. Apply it every day.
Goodbye for now. See you next time. Stay safe out there.
Bye bye bye bye.
The end. Bye.
End.
Scope and Limitations
Applies to IR / busbar thermography. FEXLINK-BMS is a FEXLINK reference; parameters follow the latest catalogue.