 微物联研究院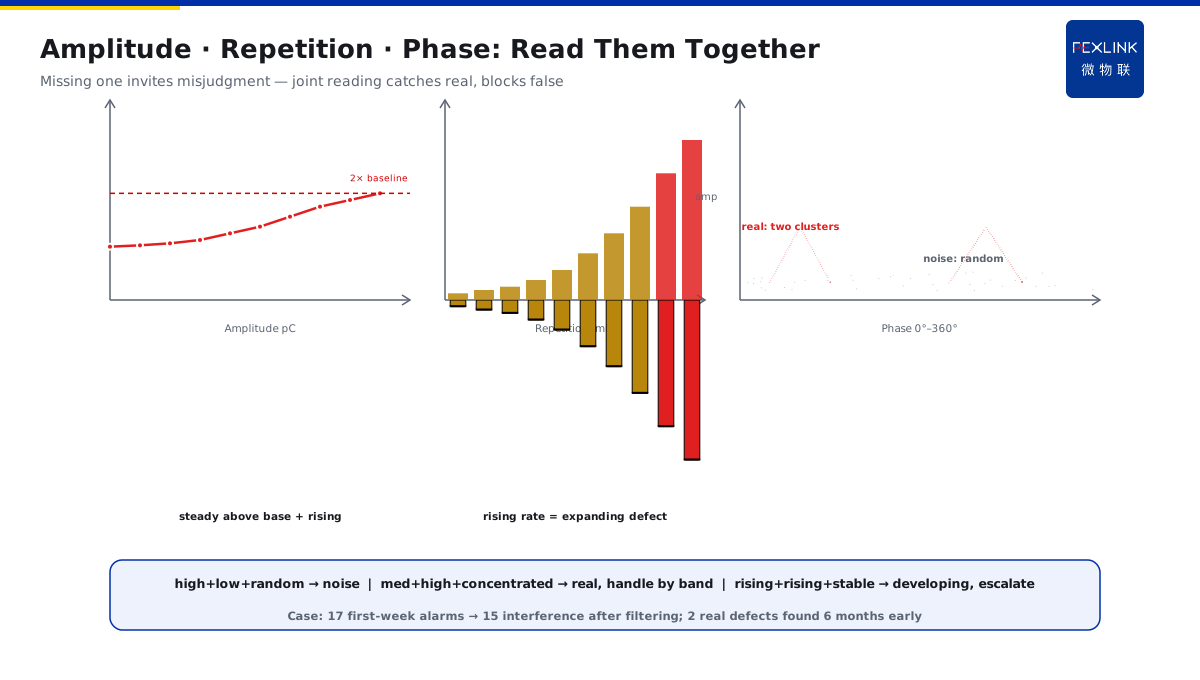
Direct Answer
The monitor shows one PD reading in pC — how high is dangerous? The answer: a single pC value is meaningless; read three numbers together — first measure background noise to set a baseline, then check whether the amplitude stays above baseline, finally whether the repetition rate grows over time. The danger signal is "amplitude steadily above baseline + repetition rate rising," not one tall pulse; a worsening trend matters more than any single absolute value.
A patrol found a switchgear PD monitor reading 820 pC; the engineer's first reaction was "over the limit, trip it now." A re-check showed background noise of 750 pC at that same moment (a nearby VFD), and the true discharge was only tens of pC — a false alarm! Another cabinet read 150 pC, seemingly low, but over three months the repetition rate climbed from 2 to 40 pulses/minute and the amplitude from 80 pC to 150 pC — that was the real problem. Conclusion: judging from a single number either scares you into action or lets the real culprit escape.
Because:
- pC is a charge unit: it characterizes the charge transferred by one discharge. Scale: <100 pC slight, 100–500 pC moderate, 500–1000 pC serious, >1000 pC severe;
- Background noise must be measured first: field interference is everywhere (VFDs, switching, corona); without subtracting the baseline, amplitudes are fictitious;
- Amplitude + repetition rate + trend: read them together — amplitude steadily above baseline with rising repetition rate is real deterioration;
- Trend beats absolute value: one tall pulse is probably interference; sustained growth is a developing defect.
Key insight: a pC number cannot speak for itself — it is "compared to what" and "how it changes" that speak. No baseline, no judgment; no trend, no warning.
At an airport's 10 kV switchgear, the first week of online PD monitoring produced 17 "discharge anomaly" alarms. On-site review found 15 were nighttime switching and construction welding interference (high amplitude but low repetition rate, no phase pattern); only 2 were genuine discharges (stable amplitude + rising repetition rate + concentrated phase). After re-filtering with the three-number rule, the false-alarm rate dropped to near zero, and two real defects were found six months early.
1. What the pC Value Means and Its Scale
pC (picocoulomb) is a charge unit: 1 pC = 10⁻¹² C. In PD monitoring, pC characterizes the charge transferred by one discharge pulse — it measures "how big this discharge is."
Common scale reference (engineering bands):
- <100 pC: slight discharge, mostly surface micro-discharge or noise residue — track it;
- 100–500 pC: moderate discharge; insulation already has a clear defect — tighten monitoring;
- 500–1000 pC: serious discharge; defect active — schedule an outage check soon;
- >1000 pC: severe discharge; insulation near breakdown — act immediately.
Note: the pC bands are a "reference ruler," not a "verdict." The same 200 pC is a real defect in a clean environment but possibly noise in a strong-interference one. Bands only make sense after subtracting background noise.
pC vs other quantities:
- pC is "charge per discharge"; repetition rate is "how many per second/minute";
- At the same pC, a repetition rate rising from 1 to 100/minute accumulates completely different energy;
- So "amplitude + repetition rate" is the complete description of discharge intensity.
Key insight: pC tells you "how big one discharge is," not "how often, worsening or improving." Those two questions belong to repetition rate and trend.
2. How to Measure and Subtract Background Noise
The biggest enemy of field PD monitoring is not the sensor — it is interference. Background noise must be "measured, subtracted, then judged":
Common interference sources:
- VFDs, inverters (power-electronics switching noise);
- Switching operations, breaker close/open (transient pulses);
- Corona discharge (sharp-point discharge; amplitude can be high);
- Welding, construction equipment (random pulses);
- Phone signals, communication gear (high-frequency interference).
Measurement methods:
- Measure baseline during normal operation: record amplitude distribution continuously for a period (at least 24 h recommended) and take a typical value as the background baseline;
- Online dynamic baseline: the platform rolls the baseline over historical data (e.g., the 95th percentile), adapting to environment changes automatically;
- Phase discrimination: genuine discharge concentrates in specific power-cycle phase windows (1st/3rd quadrant); interference is phase-random — this is the key to telling them apart.
Subtraction logic:
- Amplitude = measured − background baseline;
- Amplitude not steadily above baseline (e.g., only 20% higher) → noise, no alarm;
- Amplitude steadily above baseline by 2× or more with rising repetition rate → genuine discharge, alarm.
Key insight: the baseline is the ruler's zero point. Discussing pC bands without subtracting the baseline is measuring with a ruler that has no zero — precise digits, fictitious length.
3. Joint Reading of Amplitude, Repetition Rate, and Phase Distribution
"Handle it or not" is a three-dimension joint decision:
1. Amplitude (pC): per-discharge intensity
- Steadily above baseline and growing → watch;
- One tall pulse that quickly falls → likely interference.
2. Repetition rate (pulses/min): how often discharge occurs
- Low (<1/min) → occasional, track;
- Rising (e.g., 5 → 50/min) → defect expanding, must act;
- Repetition rate is the direct measure of "how fast the defect develops."
3. Phase distribution (PRPD pattern): where discharge sits in the power cycle
- Genuine discharge: phase-concentrated (e.g., two clusters at 30°–90° and 210°–270°), stable shape;
- Interference: phase-random, no pattern, spans the full cycle;
- Phase features are the strongest weapon for kicking interference off the alarm list.
Joint reading rules:
- High amplitude + low repetition + random phase → interference, no alarm;
- Medium amplitude + high repetition + concentrated phase → genuine discharge, handle by band;
- Amplitude rising + repetition rising + stable phase features → defect developing, escalate now.
Key insight: missing any of the three invites misjudgment. Amplitude alone gets scared by interference; repetition alone misses sudden defects; only all three together catch the real and block the false.
4. Healthy / Watch / Abnormal Three Bands
Put the three-number result into actionable bands:
Healthy (green):
- Amplitude steady near baseline (<1.5× above);
- Repetition low and stable;
- No phase concentration;
- Action: keep monitoring, re-check the baseline periodically.
Watch (yellow):
- Amplitude 1.5–2× above baseline, or repetition starting to rise;
- Phase starting to concentrate;
- Action: tighten monitoring (e.g., daily → hourly), do precision checks in the next outage window, track the trend.
Abnormal (red):
- Amplitude steadily above baseline by 2× or more;
- Repetition continuously rising (several days without falling);
- Clear phase concentration;
- Action: schedule an outage repair soon, combine other methods (ultrasonic locating, withstand test) to confirm location and nature.
Key insight: banding exists to give different states different actions, not to label equipment. Yellow-to-red is continuous — escalate by trend, not by waiting for the red light.
5. How Much Data Is Enough Before Concluding
Most misjudgments come from "too little data." The time needed depends on the question:
Short-term (hours): "was that tall pulse interference?"
- Need: the single event + 1 hour of before/after background;
- Look at: phase concentration, whether amplitude persists.
Medium-term (days–weeks): "does the equipment have real discharge?"
- Need: 7–14 days of continuous data;
- Look at: whether amplitude stays above baseline, repetition stability, day/night patterns.
Trend (months): "is the defect developing?"
- Need: at least 1–3 months of continuous data;
- Look at: amplitude trend slope, repetition trend slope, phase-feature stability.
Conclusion rules:
- Single-event data only raises "suspicion," never "conclusion";
- 24 h clean → relax the monitoring interval;
- 7 days of both amplitude and repetition rising → escalate directly — do not wait for "certainty."
Key insight: data length decides conclusion strength. One hour answers "is there a pulse"; three months answers "is the defect developing" — the value of a warning system is turning "single-event suspicion" into "trend conclusions."
6. Product Landing: PD Reading in the Digital Electrical Intelligent Supervision System
FEXLINK's Digital Electrical Intelligent Supervision System turns the "three-number rule" into automated logic:
- PD sensors (TEV/ultrasonic/UHF) sample continuously; the platform builds a dynamic background baseline automatically;
- The platform reads amplitude–repetition–phase in three dimensions and separates genuine discharge / background noise / external interference;
- The Tianyan engine runs trend analysis on amplitude and repetition: a rising slope warns before any threshold;
- The Qianzhi alarm engine pushes by health/watch/abnormal bands; abnormal directly creates a repair work order;
- The PRPD phase pattern is visualized online, so a human reviewer sees the discharge nature at a glance.
Design principle in one sentence: turn "the old hand's spectrum-reading experience" into "the platform's three-dimensional rules." Numbers cannot speak; the platform makes them speak.
7. Common On-Site Mistakes
- Judging from a single pC reading: 820 pC and shouting "breakdown," then finding 750 pC was interference. Consequence: false alarm, unnecessary outage. Correct: subtract the baseline first, then look at repetition and phase.
- Never measuring background noise: baseline unknown, all amplitude bands distorted. Consequence: real discharge drowned in noise, or noise treated as a defect. Correct: measure 24 h of baseline before judging.
- Watching amplitude only: 150 pC "is low," but repetition rose 20× in three months — defect development missed. Consequence: defects found only when severe. Correct: read amplitude + repetition together; a rising repetition rate is an escalation signal.
- Concluding from too little data: judging "healthy" after one week of monitoring. Consequence: occasional discharge averaged away, early signals missed. Correct: at least one month before trend conclusions.
- Ignoring phase: interference pulses spanning the full cycle alarm as discharge. Consequence: high false-alarm rate, alarm fatigue. Correct: filter interference with phase distribution — genuine discharge is always phase-concentrated.
Scope and Limitations
This article discusses how to read pC values from switchgear/transformer partial-discharge monitoring, applicable to online PD monitoring of MV switchgear, ring main units, and transformers. pC bands are engineering experience references; specific thresholds follow equipment type and on-site baselines. PRPD phase recognition requires sensor sampling rate and phase synchronization — confirm hardware support. All cases are anonymized (a certain substation / airport) and do not refer to any specific customer.