 微物联研究院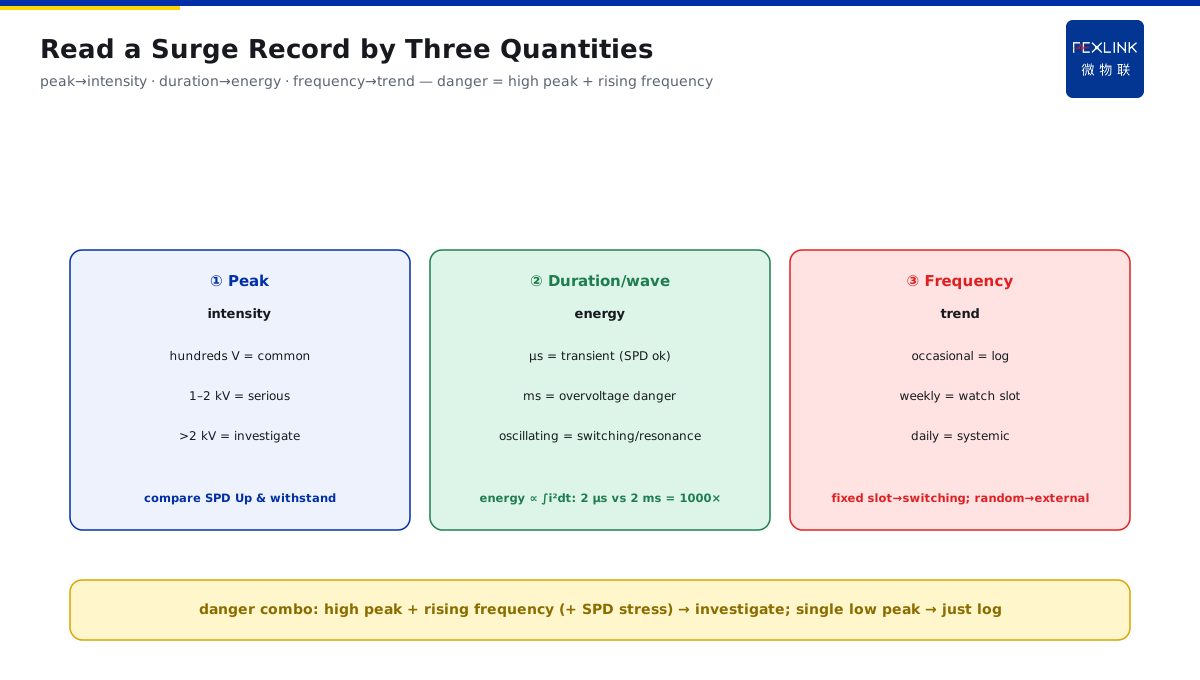
Direct Answer
The monitor logs surge events constantly — should you take them seriously or ignore them? The answer: read a surge record by three quantities — peak amplitude (intensity), duration/waveform (energy), and frequency per unit time (trend). The dangerous combination is "high peak AND rising frequency" — it points to repeated switching or grounding problems nearby. A single low-peak event just needs logging and watching; rising frequency is what demands source investigation.
At a campus electrical room, the smart lightning-protection monitor logged 17 surge events in one week. The operator's first reaction was "SPD broken or the wiring faulty?" — nearly replacing the SPD outright. Reading by three quantities: highest peak 480 V (within the low-voltage surge-protection level; SPD operating normally), duration 0.5–2 µs (transient surge, not sustained overvoltage), frequency 17/week and concentrated at the same time each day (the plant's furnace-shutdown period). Verdict: not an SPD fault, not continuous grid abnormality — repeated surges from internal load-switching, one transient per shutdown operation. The SPD checked normal; no replacement needed; a local suppressor on the switching-heavy load side was recommended. Reading the three quantities together saved the trip.
Because:
- Peak = intensity: the peak decides the threat class — in low-voltage systems, hundreds of volts is common transient; kilovolts can damage equipment;
- Duration = energy: energy ∝ ∫i²dt — same peak, 2 µs vs 2 ms is a 1000× energy difference, completely different damage;
- Frequency = trend: a single event may be coincidence; rising frequency is systemic (repeated switching, grounding degradation, SPD aging prelude);
- SPD linkage: read surge records with SPD state — frequent SPD operations + fast-rising counter = the SPD is under abnormal stress, possibly near end of life.
Key insight: a surge record is not "are there surges"; it is a combination of intensity + energy + trend. Counts alone scare you, peaks alone miss energy; the combination decides "log, watch, or investigate."
At a port shore-power system, the monitor logged 2.8 kV peaks weekly, frequency rising from 3/week to 15/week, with the SPD counter climbing in step. Combination judgment: high peak (above normal low-voltage levels) + rising frequency + SPD stress = source investigation mandatory. On-site: the shore-power connector's grounding terminal was loose, ground resistance degraded from 0.5 Ω to 4.2 Ω — every connection operation produced high-magnitude surges. After tightening, frequency dropped and the SPD counter stopped. Rising frequency + SPD stress = systemic problem, not coincidence.
1. Peak Magnitude: Levels and Consequences
The peak is the first number to read — it decides "how threatening is this surge":
Low-voltage surge levels:
- Hundreds of volts (300–1000 V): common transient — load-switch operations, small-motor starts, inductive load interruption; SPD operates normally, equipment usually unaffected;
- 1–2 kV: more serious — large-load operations, capacitor switching, grounding-system fluctuation; watch source and frequency;
- Kilovolts (>2 kV): dangerous — lightning induction, system resonance, ground faults; must investigate and check equipment damage.
Judgment points:
- Compare the peak against the equipment's impulse withstand (e.g., switch-mode supplies generally tolerate the 1 kV surge class, IEC 61000-4-5);
- Compare against the SPD voltage protection level Up — residual voltage after SPD action is typically hundreds of volts; a recorded "peak" far above Up means the SPD may have failed or the energy is excessive;
- Multiple devices on the same bus logging the same surge → real event, not single-device interference.
Engineering intuition:
- Hundreds of volts + low frequency: log only;
- Hundreds of volts + high frequency: find the repeated-switching source;
- Kilovolts + any frequency: investigate.
Key insight: the peak is the threat ruler, but only meaningful against the SPD protection level and equipment withstand. "480 V" in isolation says nothing; comparison says everything.
2. Duration and Energy
"Same peak, damage can differ 1000×" — the damage is decided by energy:
Energy = ∫i²dt (integral of current squared over time):
- Surge energy is set by peak and duration together;
- Same peak: 2 µs vs 2 ms is a 1000× energy difference;
- Short pulses (µs): lightning induction, switching transients — SPD absorbs;
- Long pulses (ms): near sustained overvoltage or resonance — SPD can overload, heavy equipment damage.
How to read the waveform:
- Short and sharp (µs): transient surge, SPD normal, log only;
- Wide and long (ms): danger signal — possibly not a surge but overvoltage/resonance — check power quality;
- Oscillating (multiple peaks): capacitor switching or system resonance — SPD operates repeatedly, high stress.
Number references:
- Lightning-induced surge: 8/20 µs waveform (standard test wave, 8 µs rise, 20 µs to half);
- Switching surge: typically tens to hundreds of µs;
- A recorded duration far beyond 20 µs (ms-class): treat as "atypical surge," check resonance/overvoltage.
Key insight: energy is the damage; peak is just the façade. Read peak and duration together — the same 480 V is trivial at 2 µs and serious at 2 ms.
3. Why Frequency Trend Matters More Than a Single Event
A single surge may be coincidence; rising frequency is the systemic signal:
Judgment value of frequency:
- Low (occasional): a few per month, moderate peak — log and watch;
- Medium (several per week): start paying attention; check for a fixed-time pattern (plant shutdowns, equipment starts);
- High (multiple per day): clearly abnormal — repeated-switching source, grounding degradation, SPD aging prelude nearby.
Frequency + time-slot analysis:
- Fixed time-slot repeats → maps to a device operation (compressor starts, furnace switching, elevators);
- Random through the day → external interference (neighboring equipment, grid fluctuation);
- Frequency rising with season → lightning season or ground degrading with humidity.
Frequency–SPD linkage:
- SPD counter rising fast + surge frequency rising = SPD under abnormal stress, near end of life (each MOV operation degrades it);
- SPD counter normal but many surge records = surges bypassing the SPD (no front-end SPD or SPD failed);
- SPD operation count vs surge events should be ~1:1; a clear mismatch demands a check.
Key insight: frequency trend separates "coincidence" from "systemic." A single record lies; a frequency curve does not — 17 events a week concentrated in one time slot already has the answer written in the trend.
4. Linking Surge Records to SPD State
Surge records are not isolated; read them with SPD state:
The SPD's three gauges:
- Operation counter: SPD operation count (recorder/telemetry) — frequent operation = high stress;
- Status indication: normal/degraded/failed (window color or telemetry) — degradation to failure is gradual;
- Leakage current (online SPDs): MOV leakage rises with aging — a doubled leakage hints at end of life.
Combined judgment rules:
- Many surges + SPD counter rising in step → SPD is working (absorbing surges) but stressed; watch life;
- Many surges + SPD counter static → surges bypassing the SPD (no front protection or SPD failed — check);
- SPD degraded indication + rising frequency → protection capacity falling; replace first;
- Surges persist after SPD replacement → problem is in the source (switching/grounding); replacing the SPD treats the symptom.
Number references:
- Typical SPD life: 5–10 years in normal surge environments; shorter in lightning-prone or switching-heavy areas;
- MOV operation life: performance degrades after hundreds to thousands of big-current impacts (spec-dependent);
- Normal leakage <1 mA (microamp class); a clear rise signals aging.
Key insight: surge records are the "phenomenon"; SPD state is the "absorber." Read phenomenon + absorber together to know whether "the SPD is working" or "the SPD is done."
5. When to Investigate the Source On-Site
Not every record deserves a site trip — three tiers by combination:
Tier 1: log only (low frequency, low peak, short duration)
- Features: a few per month, hundreds of volts, µs-class;
- Action: archive; check the trend at the next patrol.
Tier 2: watch + remote analysis (medium frequency, or fixed time slot)
- Features: several per week, ~1 kV, repeating in a fixed slot;
- Action: analyze which device maps to the slot (remote load records), confirm the switching source; keep watching if the SPD is normal.
Tier 3: must investigate (high frequency, or high peak, or SPD stress)
- Features: multiple per day, peak >2 kV, SPD counter rising fast / degraded;
- Action: on-site — ground resistance (target <1 Ω), repeated-switching source, SPD body, neighboring equipment;
- Order: ground first (degrades most easily and affects everything) → switching source → equipment body.
Investigation checklist:
- Ground resistance: target <1 Ω (lightning grounding); >4 Ω must be fixed;
- Repeated-switching sources: large-load breakers, welders, VFDs, elevators;
- SPD body: appearance / degraded indication / leakage;
- Neighboring interference: large equipment starts, external lines.
Key insight: "whether to go on-site" is decided by the combination, not by "how many times it logged." Single low peak = log; rising frequency + stress = investigate — analyze remotely first, then decide to dispatch.
6. Product Landing: Automatic Three-Quantity Surge Reading
FEXLINK's FL Transient-Current Monitor turns the "three-quantity combination" into automatic recognition:
- Captures surge events continuously, auto-logging peak, duration, waveform features;
- Auto-statistics of frequency per unit time and time-slot distribution — fixed-slot repeats get auto-correlated hints;
- Linked with the Intelligent Lightning-Protection Online Monitoring solution: SPD counter, status, and leakage unified with surge records;
- Dangerous combinations auto-tiered: high frequency + high peak + SPD stress → escalated to "must investigate" alert with a checklist;
- Surge events aligned with operation time slots, auto-suggesting "repeated-switching source" clues;
- Connected to the Digital Electrical Intelligent Supervision System, surges, SPD, grounding, and load share one dashboard.
Design principle in one sentence: turn "a pile of surge numbers" into "automatic three-quantity reading." Intensity + energy + trend decide log, watch, or investigate — the monitor tiers it for you.
7. Common On-Site Mistakes
- Looking only at counts: 17 a week treated as a fault, SPD replaced outright. Consequence: SPD replaced for nothing; the problem was the switching source. Correct: read peak + duration + frequency together.
- Looking only at peak: "480 V, not high" — reassuring, missing the rising frequency and SPD stress. Consequence: grounding degradation keeps worsening. Correct: high peak + rising frequency = investigate.
- Ignoring duration: an ms-class "surge" treated as a µs transient. Consequence: overvoltage/resonance mislabeled, SPD repeatedly overloaded. Correct: ms-class = atypical surge, check power quality.
- Surge records disconnected from SPD: logging surges without checking the SPD counter. Consequence: an SPD already dead keeps "logging surges." Correct: compare surge count vs SPD count (~1:1 expected).
- Going on-site for every record: dispatching for occasional low peaks. Consequence: high O&M cost; real systemic signals buried. Correct: tier the handling; remote analysis first.
Scope and Limitations
This article discusses surge-record reading for low-voltage distribution systems with transient-surge monitoring (including intelligent lightning-protection online monitoring scenarios). Peak, duration, and SPD protection-level thresholds follow on-site equipment and manufacturer data; the values here are engineering references. Direct lightning strikes and high-voltage system surge behavior differ and need separate assessment. SPD life is strongly environment-dependent (lightning and switching frequency). All cases are anonymized (a certain campus / port shore-power) and do not refer to any specific customer.