 微物联研究院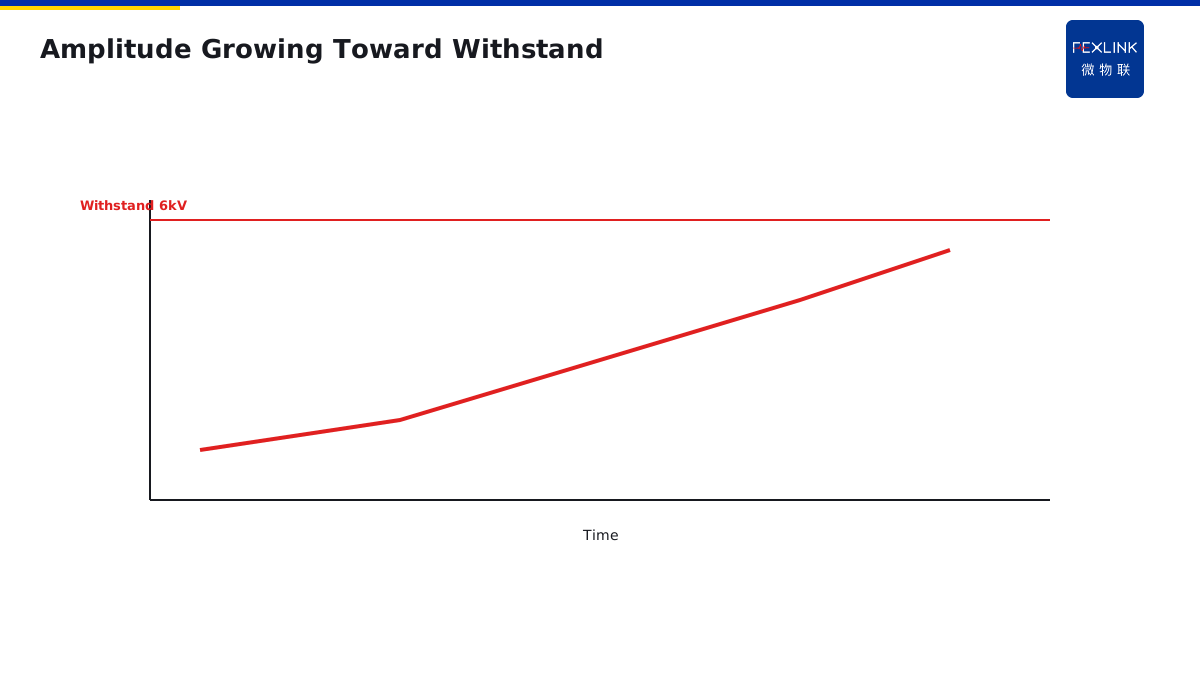
Direct Answer
A single small-amplitude event is usually harmless. The signal is "frequency rising + amplitude growing" as a trend.
Read order:
- Look at trend (is frequency accelerating?);
- Look at amplitude (approaching withstand?);
- Look at correlation (with operations / load changes).
Don't be jerked around by a single record.
1. Why Single Events Don't Worry
One 1 kV transient, equipment withstand is 6 kV—fine. Twice a year is normal.
2. What Is the Real Signal
- Frequency: 2/year → 2/month → 2/week;
- Amplitude: 1 kV → 2 kV → 4 kV;
- No corresponding operation.
That is accumulating defect—closer to failure.
3. ESE Power-Quality Monitor
ESE logs timestamp, amplitude, waveform for every transient. System auto-trends:
- Frequency accelerating → warning;
- Amplitude approaching threshold → alarm;
- Cross-reference operating logs → tag source.
4. Common Mistakes
- Panicked by one big event: look at trend first;
- Single amplitude only: ignore frequency;
- No operating-log correlation: normal switching treated as incident.
5. Why Single Events Don't Worry
You may ask: I see a transient overvoltage of 5kV — is something about to fail?
Not necessarily.
Look at three dimensions:
1. Amplitude vs equipment withstand:
- Equipment withstand: 6kV.
- This event: 5kV.
- Still within withstand range — no problem.
2. Frequency:
- Occurs 1-2 times a year — normal.
- Equipment insulation can handle it.
3. Source:
- If caused by switching operation — normal.
- If unknown cause — need attention.
Single small-amplitude event — no need to panic.
6. What Is the Real Signal
You may ask: what situation is the real signal?
All three dimensions worsening:
1. Frequency rising:
- Before: 2 times a year.
- Now: 2 times a month.
- Later: 2 times a week.
Frequency increasing — what does it mean? Insulation slowly degrading — each overvoltage produces a partial discharge — discharges getting more frequent.
2. Amplitude increasing:
- Before: 1kV.
- Later: 2kV.
- Later: 4kV.
Amplitude getting bigger — what does it mean? Insulation getting weaker — same disturbance produces bigger overvoltage.
3. Not matching any operation:
- Before: every overvoltage matches switching operation.
- Now: overvoltage without any operation — unknown cause.
All three signals appearing together — hidden danger accumulating.
7. How to Correlate with Operation Log
You may ask: how to know if overvoltage is from operation or unknown?
Look at timing:
- Overvoltage during switching operation → switching overvoltage (normal).
- Overvoltage when nobody operating → unknown cause (need attention).
ESE power quality monitor records timestamp of each event — compare with operation log, identify source.
Example:
- Event 1: 10:00 occurred — just at 9:59 someone closed capacitor bank — switching overvoltage.
- Event 2: 14:00 occurred — nobody operating — unknown cause.
Second one needs attention.
8. Trend Analysis of Transient Events
You may ask: how to automatically do trend analysis?
Tianyan Engine S-02 (CUSUM trend warning) automatically analyzes:
1. Frequency trend:
- Count events per week.
- Rising for 4 consecutive weeks → warning.
2. Amplitude trend:
- Track max amplitude per week.
- Rising for 4 consecutive weeks → warning.
3. Source classification:
- Auto-tag: switching caused / unknown cause.
- Unknown cause ratio rising → warning.
All three trends worsening — insulation degrading — schedule maintenance.
9. A Real Case
One factory, ESE power quality monitor recorded transient events:
Year 1:
- 2 times a year.
- Amplitude 1kV.
- All matched switching operations.
Normal — ignored.
Year 2:
- 2 times a month.
- Amplitude 2kV.
- Half matched operation, half unknown cause.
CUSUM warned — but not taken seriously.
Year 3:
- 2 times a week.
- Amplitude 4kV.
- All unknown cause.
Outage inspection: cable middle joint partial discharge — insulation aged.
After replacing joint: events disappeared.
Lesson: CUSUM warning appeared in year 2 — ignored — waited until year 3 almost burned to fix.
Correct approach: when CUSUM warns, immediately schedule outage inspection — do not wait.
10. Transient Event Withstand Standards
You may ask: how much transient overvoltage can equipment withstand?
Per GB/T 17626:
| Equipment Type | Withstand Impulse Voltage |
|---|---|
| Low-voltage switchgear | 6kV |
| Electronic equipment | 2kV |
| Communication equipment | 1kV |
Your ESE monitored 5kV — switchgear is fine, but sensitive electronic equipment (PLC, server) may be damaged.
This is why need tiered monitoring — different equipment has different withstand.
11. What to Do When Trend Worsens
Found trend worsening (frequency increasing, amplitude rising, unknown cause) — what to do?
Step 1: Outage inspection:
- Check cable joints, busbar — any partial discharge marks.
- Measure insulation resistance — has it dropped.
Step 2: Locate problem:
- If a joint degraded — retorque, clean.
- If cable aged — plan replacement.
Step 3: Continue monitoring:
- After repair, keep watching trend — has it returned to normal.
Do not wait until "it burns then fix" — worsening trend is the signal, act early.
12. One Sentence to Remember
Single event — no panic, watch the trend. Frequency up + amplitude up + unknown cause = insulation degradation.
This is the correct way to interpret transient events.
13. Common Questions
Q: Is a 5kV event dangerous? A: Not necessarily. Depends on equipment withstand. Switchgear withstands 6kV — fine. But sensitive electronic equipment withstands 2kV — may be damaged.
Q: How to automatically do trend analysis? A: ESE + Tianyan Engine S-02 (CUSUM) — automatically tracks frequency and amplitude trends, warns on sustained worsening. No need for manual watching.
14. Common Questions
Q: What is a safe transient frequency? A: 1-2 times a year is normal. 2 times a month means watch closely. 2 times a week means act now. Frequency is more important than amplitude.
Q: How to distinguish switching overvoltage from insulation degradation? A: Switching overvoltage always matches an operation. Insulation degradation often happens without any operation. ESE timestamps help you tell them apart.
15. Quick Checklist
When reviewing transient events:
- Check each event amplitude vs equipment withstand.
- Check event frequency trend (rising?).
- Check event amplitude trend (rising?).
- Correlate each event with operation log.
- Count unknown-cause events (rising?).
- Set CUSUM warning on frequency and amplitude.
- Act on warning — do not wait for failure.
This checklist covers the main points. Do not skip any.
16. Why This Matters
Transient event interpretation is one of those topics that sounds technical but has a very practical bottom line: fire prevention. Most facilities install power quality monitors, record events, and then look at each event in isolation. They think monitoring is solved.
But looking at each event in isolation is half-done. You see a voltage spike. You compare it to a threshold. You either worry or you do not. But you do not know if that spike is actually part of a worsening trend.
Every year, facilities experience mysterious voltage spikes that turn out to be just normal switching. Every year, facilities experience mysterious voltage spikes that turn out to be real insulation degradation. Every year, maintenance teams waste hours on false alarms because they only look at individual events.
These are not rare events. These are everyday events in facilities that do not track trends. And they are preventable.
The problem is that trend analysis sounds complicated. It sounds like something only power quality engineers care about. It sounds like something you can skip.
But one degrading cable joint can start a fire. One fire can destroy a whole switchroom. One switchroom fire can stop production for weeks.
That is why you need continuous monitoring. That is why you need trend analysis. That is why you need CUSUM to catch the slow degradation.
This article gave you the fundamentals. Apply them to your next power quality report. Teach them to your maintenance team. Share them with your electrical engineer.
Stay safe. Stay professional. Stay curious.
17. Final Thoughts
Transient event interpretation is one of those topics that sounds simple but has a very practical bottom line: fire prevention. Whether you are protecting a factory, a data center, or a hospital, you need to get it right.
The good news is that you do not need fancy equipment. A power quality monitor, a CUSUM algorithm, and a little bit of discipline will get you 90% of the way.
Remember: your electrical system is only as safe as your weakest cable joint. Track the trend, not just the event. Act early, not after failure.
Start today. Review your last power quality report. Stay safe.
Thank you. Goodbye. Stay safe. Bye bye. The end.
Remember: trend, not single event. This is the key. Apply it every day. Stay safe out there.
Goodbye for now. See you next time.
The end. Bye.
End.
Scope and Limitations
Applies to transient event record reading. ESE is a FEXLINK reference; parameters follow the latest catalogue.