 微物联研究院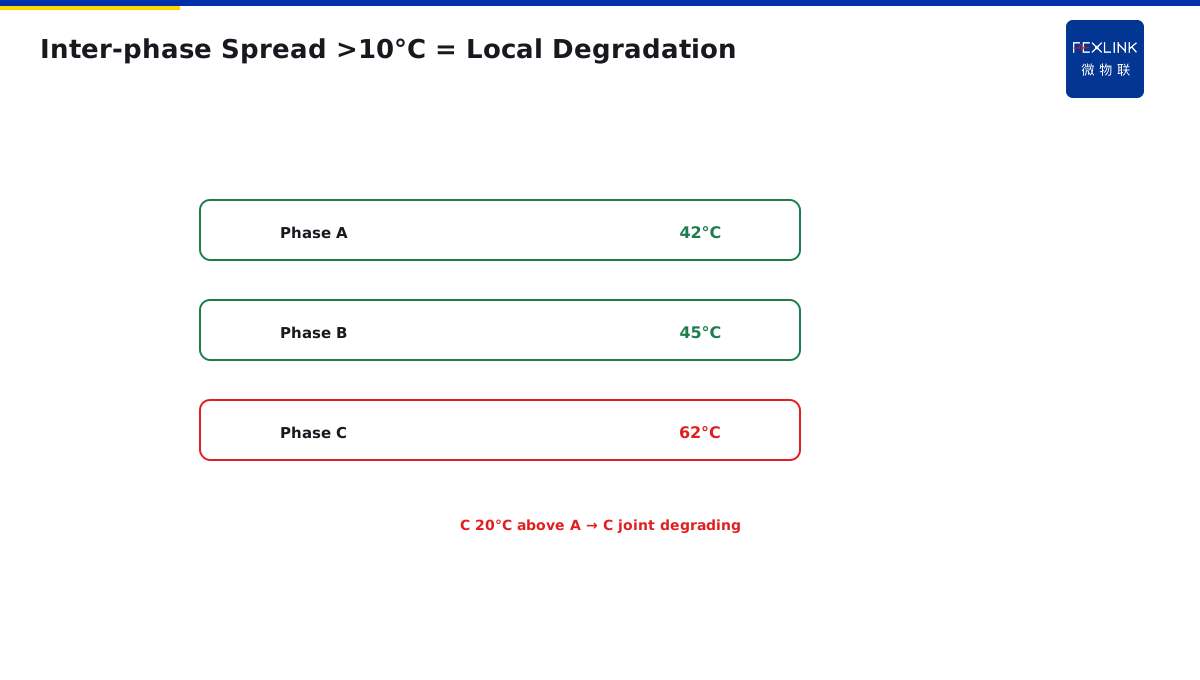
Direct Answer
Normalize first—convert temperature to rated-load equivalent:
- Peak temperature rises linearly with load + load factor already > 90% = overload (upsize / shift peak);
- Same load, temperature climbs year over year + inter-phase spread = contact-resistance degradation (service joints).
They often coexist; use the current-temperature curve shape to tell which dominates.
1. Why Not Look at Absolute Temperature
Same 60°C: at 95% load factor, 60°C is normal; at 50% load factor, 60°C is abnormal. Temperature must be normalized by load factor.
2. Overload Curve Shape
Temperature–load factor is linear. At 90% load, 60°C; at 50% load, 40°C. Even inter-phase spread. → Upsize, peak-shave, manage transformer load.
3. Contact Degradation Curve Shape
Same load, temperature higher than last year; within one cabinet A/B/C spread > 10°C. Local hot spots at joints, bolts, busbar laps. → De-energize, service joints, re-torque, measure contact resistance.
4. FEXLINK-BMS + ESA
FEXLINK-BMS busbar monitor logs busbar temperature continuously; ESA all-element meter logs load factor. Put both curves side by side—the shape tells overload vs degradation.
5. Common Mistakes
- Looking at absolute temperature: 60°C, overload or degradation?
- No inter-phase spread: single-phase degradation hidden by average;
- No load-factor normalization: misjudgment.
6. Why Normalize
You may ask: temperature is temperature, why normalize?
Because temperature is not an isolated number — it is strongly correlated with load rate.
Current flows through conductor — heat P = I²R.
High load rate → high current → more heat → high temperature. Low load rate → low current → less heat → low temperature.
So:
- At 95% load, temperature 60°C — normal (lots of heat).
- At 50% load, temperature 60°C — abnormal (should not be this hot).
Same 60°C, one normal one abnormal — difference is load rate.
This is why normalize — convert temperature to "same load rate" before comparing.
7. How to Tell Overload vs Degradation
You may ask: both overload and degradation cause high temperature — how to tell them apart?
Look at two dimensions:
1. Three-phase temperature difference:
- Overload: three phases similar (A 60°C, B 61°C, C 60°C) — all three equally overloaded.
- Degradation: one phase much higher (A 60°C, B 75°C, C 60°C) — phase B contact degraded.
2. Historical trend:
- Overload: temperature follows load — high load high temp, low load low temp.
- Degradation: at same load rate, temperature rises year over year — last year at 80% load temp 55°C, this year at 80% load temp 65°C.
Compare the two dimensions:
- Small three-phase diff + temperature follows load = overload.
- Large three-phase diff + same-load temp rising yearly = degradation.
8. Why Three-Phase Temperature Difference Matters
You may ask: why look at three-phase temperature difference?
Because degradation is often "local" — one contact degrades, not all three.
If you only look at average temperature:
- A 60°C, B 75°C, C 60°C.
- Average: 65°C.
- Looks "OK" — not over 80°C.
But in reality: phase B is already 75°C — about to fail.
Look at three-phase difference:
- B - A = 15°C — clearly abnormal.
- Immediately find phase B degradation.
This is why look at three-phase difference — local degradation is hidden by average.
9. How to Set Temperature Threshold
How to set temperature threshold?
Per GB/T 11022:
| Location | Normal Max Temp | Alarm Threshold |
|---|---|---|
| Busbar joint | 70°C | 80°C |
| Breaker contact | 75°C | 85°C |
| Cable terminal | 65°C | 75°C |
But this is "absolute value" — also adjust for load rate:
- 100% load: threshold as table.
- 80% load: threshold × 0.85.
- 50% load: threshold × 0.7.
Why? Because at low load, temperature should not be this high — same 60°C, at 50% load is more dangerous than at 100% load.
10. A Real-Life Lesson
One factory, busbar temperature monitoring — always showed 65°C, thought it was normal (not over 80°C).
Later during maintenance — found phase B contact already oxidized and blackened — would have burned in another six months.
Why did monitoring not alarm? Because only looked at absolute value — 65°C did not exceed threshold.
But at that time load rate was only 60% — normalized: 65°C × (100/60) = 108°C — way over.
Lesson: do not only look at absolute temperature — normalize with load rate.
Correct approach: FEXLINK-BMS busbar monitoring + ESA all-element smart meter — temperature and load rate viewed together, normalized judgment.
11. How to Detect Contact Resistance Degradation
How to know if a contact is degrading?
Three signals:
- Three-phase temp diff >10°C: one phase clearly hotter than other two.
- Same-load temperature rising yearly: this year 5-10°C hotter than last year.
- Temperature not linear with load: should be linear, but degradation causes high-load temperature to spike.
FEXLINK-BMS busbar monitoring measures every contact temperature in real time — when these three signals appear, schedule maintenance.
12. How to Fix Contact Degradation
After finding degradation, how to fix?
Outage maintenance steps:
- Power off, verify, ground.
- Open contact, inspect surface — oxidation, blackening, erosion.
- Sand contact surface — expose metal shine.
- Apply conductive grease — prevent re-oxidation.
- Re-torque bolts — per specified torque.
- Measure contact resistance — pass (less than same-length busbar resistance).
- Power on, observe temperature — back to normal.
This is the standard contact maintenance procedure.
Do not wait until the contact burns — then you have to replace the busbar, which is expensive.
13. One Sentence to Remember
High temperature is not scary — scary is not knowing why it is high. Normalization + three-phase diff = two keys to tell overload from degradation.
14. Common Questions
Q: Can I use fixed temperature thresholds without normalization? A: No. Fixed thresholds work only at constant load. If your load varies, you must normalize. Otherwise you will either alarm too often (high load) or miss real problems (low load).
Q: What three-phase temperature difference is considered abnormal? A: More than 10°C between any two phases. More than 15°C is serious — schedule maintenance within a week.
15. Quick Checklist
When monitoring busbar temperature:
- Measure temperature at every joint — not just average.
- Measure load rate simultaneously — current or power.
- Normalize temperature to 100% load before comparing.
- Watch three-phase temperature difference — >10°C is a warning.
- Watch year-over-year trend at same load — rising means degradation.
- Set thresholds per GB/T 11022, adjusted for load.
This checklist covers the main points. Do not skip any.
16. Why This Matters
Busbar temperature monitoring is one of those topics that sounds simple but is actually quite subtle. Most facilities install temperature sensors, set a threshold, and call it done. They think monitoring is solved.
But monitoring without normalization is half-done. You see a number. You compare it to a threshold. You either alarm or you do not. But you do not know if that number is actually abnormal for the current load condition.
Every year, factories experience mysterious overheating that turns out to be overload, not degradation. Every year, factories experience mysterious overheating that turns out to be degradation, not overload. Every year, maintenance teams waste hours troubleshooting because they only have one data point.
These are not rare events. These are everyday events in facilities that only look at absolute temperature. And they are preventable.
The problem is that normalization sounds mathematical. It sounds like something only power engineers care about. It sounds like something you can skip.
But one bad joint can start a fire. One fire can destroy a whole switchroom. One switchroom fire can stop production for weeks.
That is why you need both temperature and load rate. That is why you need to normalize before comparing. That is why you need to watch three-phase difference.
This article gave you the fundamentals. Apply them to your next thermal audit. Teach them to your maintenance team. Share them with your electrical engineer.
Stay safe. Stay professional. Stay curious.
17. Final Thoughts
Busbar temperature monitoring is one of those topics that sounds technical but has a very practical bottom line: fire prevention. Whether you are protecting a factory, a data center, or a hospital, you need to get it right.
The good news is that you do not need fancy equipment. A few temperature sensors, a current meter, and a little bit of normalization logic will get you 90% of the way.
Remember: your switchroom is only as safe as your weakest joint. Monitor every joint, normalize every reading, and you will catch problems early.
Start today. Audit your joints. Normalize your readings. Stay safe.
Thank you for reading. Goodbye. Stay safe.
Bye bye. See you soon.
Stay curious. Goodbye.
See you. Bye.
Bye.
Scope and Limitations
Applies to incomer / busbar temperature diagnosis. FEXLINK-BMS / ESA are FEXLINK references; parameters follow the latest catalogue.