 微物联研究院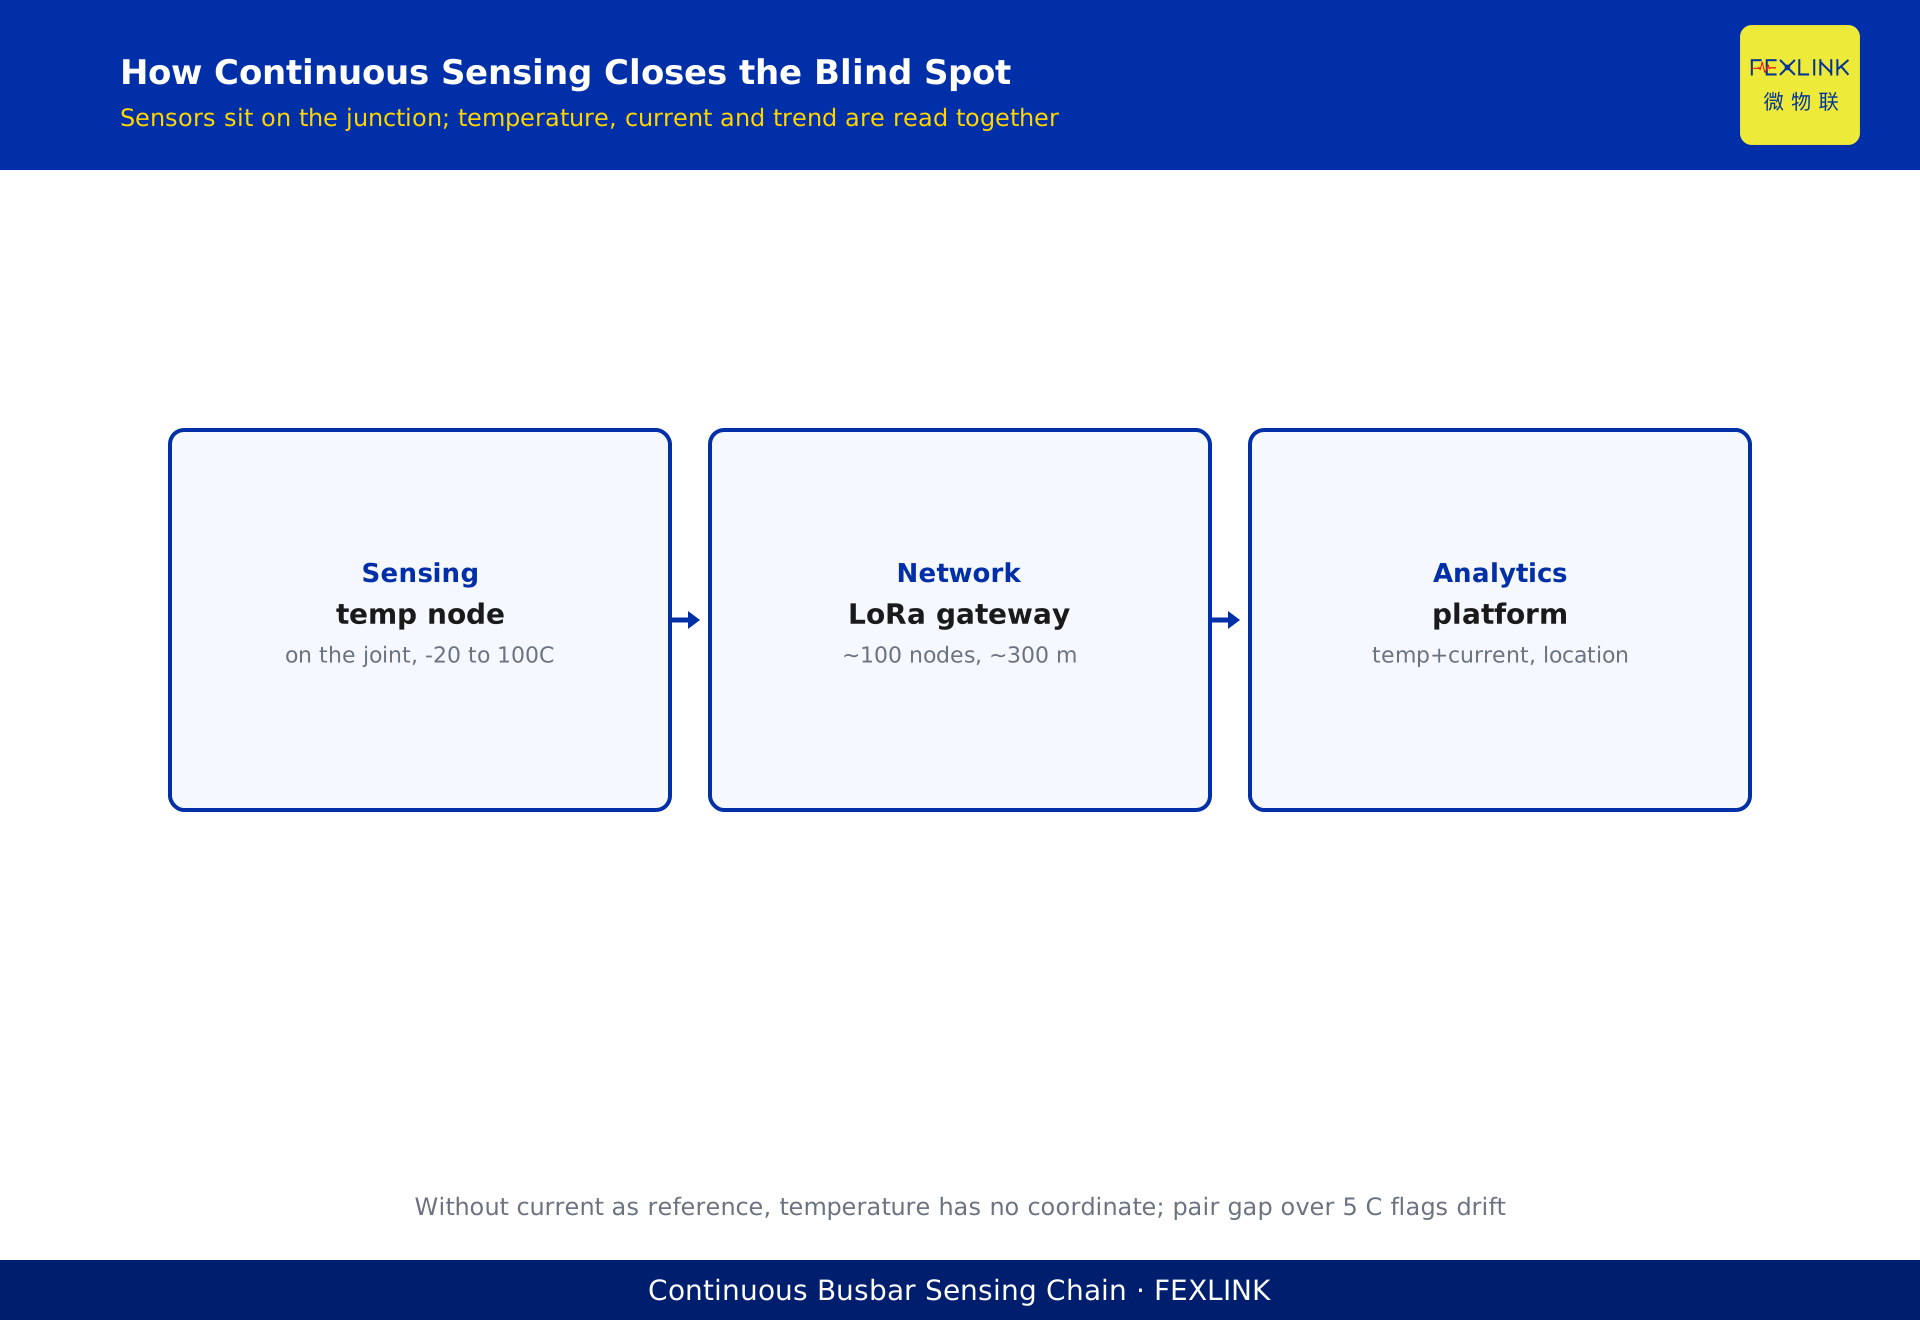
Direct Answer
When a low-voltage busbar joint overheats, the root cause is not the busbar itself—it is a rising contact resistance at the joint that turns an otherwise invisible connection into a localized heat source. It follows an almost inevitable feedback loop: contact resistance rises → local temperature rises → oxidation and thermal cycling loosen the joint → resistance rises further → temperature climbs until the joint welds, arcs, or ignites its surroundings. By the time a thermographer sees visible discoloration or can feel the heat through the cabinet, the site is often standing at the door of failure.
The way to shift from "repair after the fact" to "act before the fact" is not to do infrared inspections more often. It is to mount continuous-temperature sensors directly at the joints and read temperature together with current and trend. When the heating slope, the temperature spread versus a neighboring joint, or the deviation from the expected value at a given load begins to look abnormal, the platform raises an early warning—typically weeks before any visible discoloration. This is exactly what the FEXLINK busbar monitoring solution (built on the EST wireless temperature series and the digital electrical supervision platform) delivers in generic sites such as a manufacturing park or a factory plant.
1. Why Joints Heat Up: Contact Resistance Is the Source
The busbar body rarely causes the trouble. A properly sized copper bar carrying 1000A stays within design temperature rise. The heat concentrates at connection points: bolted overlaps between bar sections, bar-to-breaker interfaces, and bar-to-cable terminals.
The physics is simple: the power dissipated at a joint is roughly current squared times contact resistance (P = I²R). At the same 1000A, if the contact resistance degrades from tens of micro-ohms to several hundred, the heat rises several-fold. The larger the load, the more violent the heating—which is why these failures cluster during summer peaks and full production runs.
Why does contact resistance grow? Four common causes: insufficient torque that loosens under cycling; oxidized or dusty contact surfaces with damaged plating; galvanic corrosion between dissimilar metals; and busbar deformation after a short circuit that releases clamping pressure. All four share one trait: invisible to the eye, found only by disassembly, yet accumulating heat around the clock.
2. The Feedback Loop: Once Heating Starts, It Rarely Stops
The most dangerous property of joint heating is that it is not linear—it self-accelerates past a threshold.
Hot contact surfaces oxidize, and the oxide layer is itself resistive; galvanic corrosion on copper-aluminum joints is worse. Busbars expand and contract with every load swing, and each thermal cycle micro-moves the bolts a little looser. Hence the loop: temperature up a little → oxidation and looseness worsen → resistance up again → temperature up more. A common field pattern is a joint creeping from 45°C to 60°C over two or three months, then spiking to 90°C in a single week. The slow climb is the "warning window"; the sudden jump is already near weld-down.
The takeaway: we are not chasing "how hot is it now," but "how abnormal is the slope." A stable 58°C joint that has held for three years may simply run light; a joint that climbed from 42°C to 58°C in three weeks is already on a dangerous track despite its modest absolute value.
3. Why Periodic Infrared Always Arrives Too Late
Many plants run infrared thermography quarterly or semi-annually, issue a report, and move on. This catches some obvious overheating but is nearly blind to the early feedback stage.
First, obstruction: cabinet doors are closed, the bar is hidden behind covers and insulation, and the gun reads the enclosure temperature—often tens of degrees below the true joint. Second, interval: the feedback loop can complete a full cycle between two inspections. Third, incomparable conditions: today's reading at 60% load cannot be compared to last month's at 100% load—comparing temperatures without load context is the most common misjudgment in IR reports. Periodic inspection finds what is already broken; it does not find what is about to break.
4. How Continuous Sensing Closes the "Invisible" Gap
Continuous sensing places the sensor on the joint itself, not behind a cabinet door. The FEXLINK EST temperature series offers two routes: wired NTC and wireless active sensing (LoRa), spanning −20 to 100°C at ±1°C accuracy; the wireless path supports about 100 nodes per gateway, a 1-minute sampling period (configurable), and roughly 300 meters of range. In a medium-sized switch room, putting a wireless node on every key overlap equals a 24/7 thermometer on each joint.
The value of wireless is installation without shutdown. Working busbars are not taken out of service casually. The nodes are small, bonded or clipped near the overlap, and mounted on 35mm rails or brackets—deployable inside a routine inspection window. Data flows over LoRa to an edge gateway, then into the digital supervision platform, sitting alongside current, voltage, and residual-current readings on one dashboard.
5. Correlating Current: Real Hazards vs. False Hotspots
A high temperature reading is not automatically bad; a low one is not automatically safe. The discriminative signal is temperature versus load.
A heavily loaded joint at 70°C that has run there for years, rising and falling with load, may simply have tight design margins. A lightly loaded joint at 55°C deserves suspicion—under light load, a healthy joint should sit only a few degrees above ambient. Pulling the real-time current onto the same screen lets the system compute "at this load, what should this joint read, and how far is it off?" That deviation is far more reliable than the bare number. This is why a standalone thermometer is not enough: without current as a reference, temperature has no coordinate system. The FEXLINK busbar solution samples nodes together with CT or existing meter data, so each joint shows three lines—temperature, load, deviation.
6. Trend Analysis: Turning Numbers into Lead Time
With continuous data, the question changes from "how hot now?" to "which way is it heading, and how much time is left?"
This is the analysis layer of the TAI ONE hub: it fits the joint temperature trend, flags abnormal heating slopes, and runs group comparison—when neighboring joints on the same bar differ by more than about 5°C, it signals that one point has drifted from the pack. A highly practical rule of thumb in the field: the within-group spread. Adjacent joints share load and cooling, so their temperatures should track together; if one runs more than 5°C hotter than its neighbors, regardless of the absolute value, it warrants a planned shutdown check. This rule needs no precise load model and is easy for crews to act on. Per the company's disclosed figures, continuous sensing plus trend analysis can provide lead time on the order of weeks for early contact hazards; actual lead time depends on sampling strategy and load swing, and is confirmed at project acceptance.
7. Location Awareness: One Temperature, Different Risks
An overlooked fact: 65°C means very different things depending on where it is measured. On a transformer winding it may be normal; mid-bar it is moderate concern; on a line terminal it is high risk; on cable insulation it means the insulation is thermally aging and must be handled immediately.
The FEXLINK TAI system bakes this "location semantics" in: it maintains independent thresholds and risk models for five typical topological positions (point of common coupling, main switchboard, distribution panel, feeder line, load terminal), and can drill an alert down to terminal level and contact-point level via a scene-location tree. On a busbar this means the platform knows "this alert is the bar-to-breaker overlap in cabinet No.3, not the mid-bar"—the alert carries a location, so the crew no longer flips through drawings to find the point.
8. Engineering Deployment: Where Nodes Go
Coverage does not need to be uniform—it needs to be aimed. A practical priority order:
First, the overlaps between the main bar and the transformer low-voltage side and main incoming breaker—highest current, whole section affected if one fails. Second, heavy feeders (main workshop incomers, capacitor banks, transformer feeds). Third, joints with a history of heating or IR spread. Fourth, enclosed joints the infrared gun cannot reach. A medium switch room typically has 20 to 40 priority overlaps—right in the economical range of one wireless gateway. Install nodes near the overlap rather than mid-bar; tag each node with its circuit and location label; keep wireless nodes away from the strong EM field directly above heavy busbars and mount the gateway centrally. After deployment, run a two-to-three-week baseline period so the platform learns what normal looks like at this site before arming alerts.
9. Common Misconceptions
Three recurring mistakes. One, install sensors but skip the baseline: without it the system does not know normal, and the first week is all noise—allow a learning period. Two, set a fixed threshold: a blunt "alarm above 80°C" fires every day on summer peaks; the threshold must react to load and within-group spread, not a one-size cutoff. Three, alerts with no owner. The value loop is alert → locate → shutdown check → retighten/replace → re-test confirmation; missing any later step reduces continuous sensing to a dashboard decoration. FEXLINK configures the workflow, owners, and re-judgment criteria into the platform at delivery, so the warning actually reaches the person who acts.
Scope and Limitations
This article addresses contact overheating at low-voltage busbar joints in switchgear, busbar trunking, and bolted overlaps, for 0.4kV and below AC systems. The 5°C within-group rule, the −20 to 100°C range, ±1°C accuracy, about 100 nodes per gateway, ~300-meter range, and 1-minute sampling come from the FEXLINK EST temperature series knowledge base; GB/T 7251.6-2015 and IEC 61439-6:2012 are the relevant design and verification references. Lead-time figures are disclosed-capability claims and are confirmed at project acceptance. All "generic park / generic plant" scenarios are anonymized and do not refer to any specific customer. High-voltage systems, DC systems, and bar-body fractures are out of scope and require dedicated testing.