 微物联研究院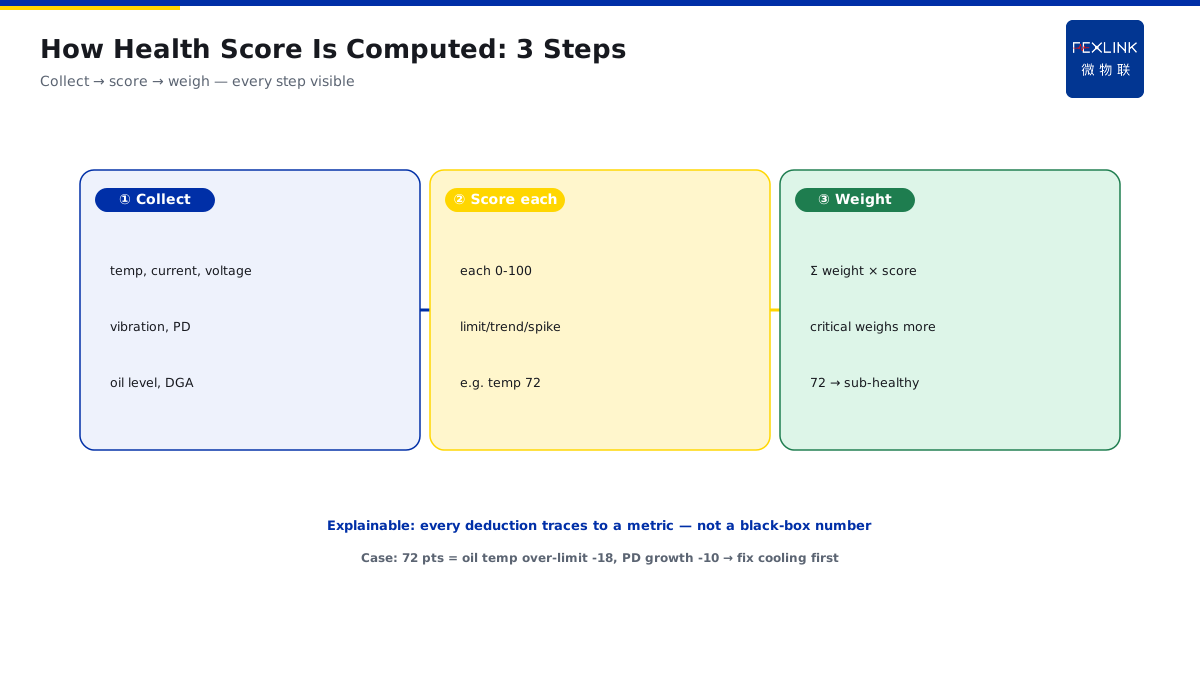
Direct Answer
The platform gives a "health score of 72." Engineers want to know how this number is calculated, and whether they can trust it. The answer is: multi-parameter normalization → weighted sum → threshold grading. Every step has its logic, not made up out of thin air.
Many engineers have this question: the platform shows equipment health score 72. Where does this number come from? Is it reliable? Why not 80? What are the deductions? Because:
- Multi-parameter normalization: different parameters have different units, must first normalize to 0~100 points;
- Weighted sum: different parameters have different importance, some weights are high, some are low;
- Threshold grading: after calculating total score, grade into healthy/fair/bad/critical;
- Explainability: must tell you what the main deductions are.
Key insight: health score is not a black box, it is a white-box model. How each parameter is normalized, what the weights are, how thresholds are set — all are explicit. You can see how the score is calculated, then you know whether to trust it.
One factory, the platform shows a transformer health score 65. Engineer took one look, felt the score was wrong — this transformer just finished testing, all normal. Clicked in: main deductions were oil temperature trend rising + load rate fluctuating. Although single test was normal, long-term trend was indeed worsening. Engineer was convinced — the score made sense.
1. Common Multi-Parameter Normalization Methods
Different parameters have different units, how to normalize to 0~100?
Linear normalization:
- Parameter from lower to upper limit, linearly mapped to 0~100 points;
- For example temperature: 20°C = 100 points, 80°C = 0 points;
- Every 1°C rise, minus 1.67 points.
Threshold normalization:
- Below threshold = full score;
- Above threshold = start deducting;
- Above alarm value = 0 points;
- Suitable for parameters where "problems only start after exceeding some value."
Trend normalization:
- Compare not to absolute value, but to historical baseline;
- How much it deviates from baseline, that much is deducted;
- Suitable for parameters that "slowly drift."
Key: different parameters use different normalization methods. Cannot use linear normalization for everything. Choose method based on parameter characteristics.
2. How Weights Are Set by Equipment Type and Location
How are different parameter weights determined?
Different equipment types:
- Transformer: oil temp, oil level, load rate have high weight;
- Circuit breaker: operating time, break count have high weight;
- Cable: temperature, insulation resistance have high weight.
Different locations:
- Incoming equipment: high weight, because impact is big;
- Feeder equipment: medium weight;
- End equipment: low weight, because impact is small.
Example:
- Transformer health = oil temp × 30% + oil level × 20% + load rate × 20% + winding temp × 30%;
- Breaker health = operating time × 40% + break count × 30% + opening/closing waveform × 30%.
Key: weights are not made up, they are set by equipment type and location. Whatever parameter has big impact on equipment safety, that parameter gets high weight.
3. Threshold Grading and Action Mapping
Total score calculated, how to grade?
90~100 points: Healthy
- Good condition;
- Action: normal inspection.
70~90 points: Fair
- Minor issues, not urgent;
- Action: watch trend, plan inspection.
50~70 points: Bad
- Clear degradation;
- Action: schedule maintenance, do not delay.
< 50 points: Critical
- Severe abnormality, failure could happen anytime;
- Action: immediate shutdown, emergency handling.
Key: grading must correspond to action. Not just give a score, also tell operations "what to do at this score."
4. Score Explainability: Where Deductions Come From
Why must health score be explainable?
Because:
- Engineer sees 72, wants to know why it is 72;
- If you only give a total score, not tell deductions, they do not dare trust it;
- Explainable = can see how many points each parameter deducted;
- Then you know what to focus on.
Explainability must include:
- Total score;
- Each parameter's score;
- Main deductions;
- How many points deducted;
- What action is recommended.
FEXLINK FSE edge computing gateway, when calculating health score, also outputs "main deductions" list. Engineer sees at a glance: oh, oil temp trend deducted 15 points, load fluctuation deducted 10 points. Now they understand.
5. How the Model Iterates with Site Data
How does health score model iterate with site data?
Initial model:
- Based on manufacturer data, industry standards;
- Start running.
Site calibration:
- Collect site data;
- Compare scores to actual failures;
- Find which parameters have wrong weights;
- Adjust weights and thresholds.
Continuous iteration:
- The longer it runs, the more accurate it gets;
- Because it better understands this site's equipment characteristics.
Key: health model is not fixed, it gets more accurate over time. At first it may be off, but as site data accumulates, it fits reality better.
6. A Real Case
One factory, platform shows a 10kV switchgear health score 68.
- Engineer took one look: yeah, indeed there have been some issues lately;
- Clicked in to see deductions: partial discharge signal growing (-15 points) + contact temperature high (-12 points) + operating time drift (-5 points);
- Scheduled outage inspection: found contacts were indeed oxidizing, PD was indeed developing;
- After handling, health score recovered to 85.
If they only gave a 68, not told what deductions, engineer might not know where to check. With explainability, they know what to focus on.
7. Three Common On-Site Mistakes
Mistake 1: only look at total score, not deductions. Total score tells you "how good," deductions tell you "what is bad." Both must be looked at.
Mistake 2: one-size-fits-all weights. Different equipment types should have different weights. Cannot use the same weights for all equipment.
Mistake 3: model set and forget. Equipment is changing, site is changing, model must iterate too. Cannot install and ignore.
8. One Sentence to Remember
Health score = multi-parameter normalization → weighted sum → threshold grading. Weights set by equipment type and location, grading maps to action. Score must be explainable, must iterate with site data.
Health score is not a black box, it is white-box — you can see how it is calculated, then you trust it.
9. Common Questions
Q: Health score 72, is it good or bad? A: Depends on grading standard. By our standard, 70~90 is "Fair" — minor issues, not urgent, just watch the trend. Not that you must fix it right away.
Q: Is health score accurate? Could it be wrong? A: At first there may be some deviation, but as site data accumulates, it gets more accurate. And the score is explainable — you can see the deductions, and judge for yourself whether it is accurate.
10. Why This Is Becoming More Important
As grids get more complex and equipment gets more expensive, condition-based maintenance is replacing fixed-interval maintenance. And condition-based maintenance requires knowing equipment condition. Which requires a health score.
But a health score that you cannot explain, you cannot trust. And a health score that you cannot trust, you will not act on. That is why explainability is not optional, it is essential.
FEXLINK provides explainable health scores. You see the total. You see the deductions. You decide what to do. That is how condition-based management works.
Stay safe. Stay professional. Stay curious.
11. Quick Checklist
Before you trust your next health score, run through this checklist:
- Can you see how the score is calculated, or is it a black box?
- Can you see the main deductions, or just the total?
- Are weights tailored to your equipment type, or one-size-fits-all?
- Does the score come with recommended action, or just a number?
- Does the model iterate with your site data, or fixed forever?
If you answered "no" to most of these, your health score system may be less useful than you think. It may give you a number, but not the insight you need to act.
The FEXLINK platform helps you make health scores actionable. FSE calculates the score. The platform shows the breakdown. You see what is wrong. You decide what to do. That is the whole point of health scoring.
12. How to Build a Routine
A good health score routine starts with baseline. When new equipment is commissioned, record all its parameters under normal conditions. That is your baseline. Then the score compares everything to baseline.
Review the scores regularly. Do not just set it and forget it. Every month, look at which equipment scores are trending down. Those are the ones to watch.
Adjust thresholds over time. If the same equipment always scores 95, maybe your threshold is too lenient. If another always scores 50, maybe your threshold is too strict. Tune them to match reality.
Start today. Pick your most critical equipment. Install monitoring. Set up the health score baseline. Then you can make smart maintenance decisions, not emergency ones.
Final Thoughts
Health scores are a powerful tool for modern electrical maintenance. They turn dozens of raw parameters into one simple number. But that number must be trustworthy. It must be explainable. It must map to action.
When it is, it becomes your most useful maintenance dashboard. When it is not, it becomes just another number nobody pays attention to.
Do it smart. Do it explainably. Do it with data.
Your equipment will thank you. Your maintenance team will thank you. Your budget will thank you. Stay safe, and keep monitoring.
See you in the next article. Take care, and remember: health scores tell a story — read them early, read them right.
That is all for this article. Good luck, and stay health-score-smart. Until next time.