 微物联研究院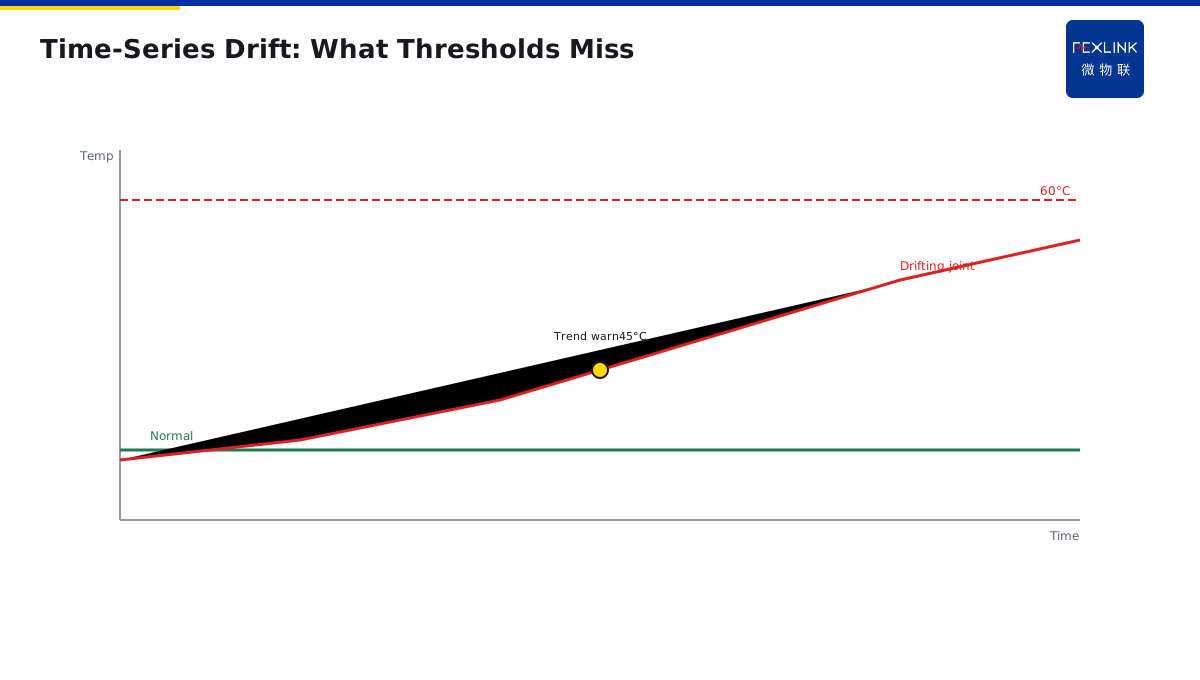
Direct Answer
A predictive-maintenance loop has five steps: continuous sensing → edge/cloud trend analysis → tiered warning → work order → tracked closure.
Many enterprises install sensors and meters, data flows in, but nothing happens—because two links are broken: no trend analysis (threshold-only alarms miss drift), or no work-order closure (alarms pile up unhandled). Miss either, and data never becomes maintenance.
1. The Five Steps
Step 1: Continuous sensing. Temperature, current, residual current, contact temperature—not "measured once during inspection," but sampled every minute or every second. FEXLINK-BMS monitors busbar joint temperature; EST-22920-R multi-channel temperature controller reads cabinet NTC points; ESA all-element smart meter samples three-phase current and voltage. Data is time-series, not snapshots.
Step 2: Trend analysis. Data alone is useless without drift detection. 35°C today, 36°C tomorrow, 37°C—each day looks fine, but over three months the climb from 35°C to 45°C is the story. Tianyan S-02 runs CUSUM accumulation; Qianzhi engine does single-parameter baselines; Wanxiang engine fuses multiple parameters. This is what separates predictive maintenance from ordinary alarm systems.
Step 3: Tiered warning. Not all anomalies are equal. Slow creep is "watch"; a 15°C jump in a week is "warn"; over 70°C is "critical." Tiering decides who gets paged and how fast they must respond.
Step 4: Work order. A warning cannot live as an app notification. Taiyi automatically generates an order: which asset, which point, recommended action, due date. The order goes to the maintenance crew with status, sign-off, and acceptance.
Step 5: Tracked closure. After the order is closed—did temperature fall? What was the root cause? Joint replaced or bolt retorqued? Results feed back to calibrate the next threshold. Only when the loop turns does it become predictive maintenance.
2. The Two Most Common Breakpoints
Breakpoint 1: Threshold-only, no trend. People set a 60°C alarm and feel safe as long as it doesn't trip. But a joint creeping from 35°C to 58°C over six months means you did nothing for half a year. By the time 60°C alarms, contact resistance is already severe. Trend analysis warns you at 45°C to "schedule an inspection," not at 60°C when it may be too late.
Breakpoint 2: Alarms pile up, no closure. A platform firing 50 alerts a day gets muted. Alarms become noise; real issues get buried. The root cause is no tiering, no work order, no closure. Tiered, maybe only 2 need action daily; the rest auto-archive. With sign-off and acceptance, crews take alerts seriously.
3. Without Trend Analysis
One campus substation installed 20 temperature sensors at 60°C threshold. Two years, no alarms. Third summer, a busbar joint burned out, 8-hour outage. Post-incident review showed the joint crept from 32°C (year 1) to 41°C (year 2) to 55°C (year 3 summer)—never crossing 60°C, but the drift was unmistakable.
With trend analysis, the year-2 climb to 41°C would have triggered "abnormal temperature rise, recommend outage inspection." No need to wait for fire.
4. Without Work-Order Closure
A factory went live with a monitoring platform. Year 1, everyone responded. Year 2, a dozen daily alerts got tiring; notifications were turned off. Year 3, a joint overheated and caught fire. Platform records showed: this joint had been abnormal for two months, fired 47 alerts, none handled.
Root cause: no work-order closure—alarms stopped at the screen, never became "who does what by when." Forty-seven alerts equal zero.
5. Engineering Rollout
Don't build it all at once. Three-phase approach:
- Sensing first: temperature and current on critical circuits (busbar joints, capacitor cabinets, transformer LV side). ESX edge gateway handles local acquisition.
- Trend analysis next: feed data to the platform, enable Qianzhi single-parameter baseline and Tianyan S-02 CUSUM. Observe three months to establish baseline.
- Work-order closure last: Taiyi auto-dispatches; crews sign off on mobile. Once running clean, expand coverage.
One airport terminal substation followed exactly this path: year 1 busbar temperature, year 2 trend analysis, year 3 work-order closure. Over three years, unplanned outages dropped from 3/year to zero.
6. Why "Installed Sensors" Does Not Mean "Doing Predictive Maintenance"
Many companies think: installed temperature sensors, installed energy meters, data flowing to the cloud — predictive maintenance is done.
Wrong. Sensors are only the first step. They are the "eyes." Predictive maintenance needs three things: "eyes + brain + hands."
- Eyes (perception layer): sensors, meters, monitors — collect data.
- Brain (analysis layer): trend algorithms, anomaly detection — find problems in data.
- Hands (execution layer): work orders, maintenance, acceptance — fix the problems.
Eyes without brain: data flows, but nobody knows what it means. Eyes without hands: problems found, but nobody fixes them.
Many companies get stuck at "eyes only" — installed 50 sensors, data sits on the platform, nobody ever reads the trend reports. Three years later, equipment still fails, because data never became action.
This is why the five-step loop matters more than sensor count — 5 sensors + complete loop is more useful than 500 sensors + no loop.
7. What CUSUM Trend Analysis Actually Calculates
You may ask: what does the Tianyan Engine S-02 CUSUM actually calculate? Why does it find problems earlier than "set a threshold"?
CUSUM = Cumulative Sum. The idea is:
- Not "is today's temperature over the limit?"
- But "compared to baseline, how much has the temperature drifted cumulatively?"
Example:
- Normal baseline: 35°C.
- Week 1: 36°C (+1).
- Week 2: 37°C (+2).
- Week 3: 38°C (+3).
- Week 4: 39°C (+4).
Week by week: 36°C, 37°C are not over the limit (threshold 60°C). But CUSUM cumulative drift = 1+2+3+4 = 10 — this cumulative value crosses the warning line, meaning temperature is rising continuously, not normal fluctuation.
This is the value of CUSUM: it warns you "this trend is wrong" when temperature is only 39°C, not when it reaches 60°C.
Normal threshold alarm calls after the accident. CUSUM calls before the accident. This is the essential difference between predictive maintenance and ordinary monitoring.
8. Three Key Metrics for Loop Success
How do you know your predictive maintenance loop is working? Look at three metrics:
- Warning response rate: of all warnings issued, how many are acknowledged and handled on time? Target >90%. If only 30%, work orders are not closed.
- Unplanned outage count: after installing monitoring, unplanned outages should decrease year by year. If they do not, trend analysis is not working.
- Warning accuracy: of all warnings sent, how many turn out to be real problems? Target >70%. If only 20%, there are too many false alarms, and maintenance teams become numb.
These three metrics are the hard standard for whether the loop is truly working. Installed sensors but these three metrics did not improve — equals wasted installation.
9. One Sentence to Remember
Predictive maintenance is not about sensors. It is about the loop. Sensors without trend analysis are just data logging. Trend analysis without work orders are just warnings. Work orders without closure are just notifications. The loop is what makes it predictive.
10. Common Questions
Q: How many sensors do I need? A: Fewer than you think. Start with the critical points — busbar joints, capacitor cabinets, transformer LV side. 5 sensors with a complete loop beats 500 sensors without one.
Q: How long does it take to see results? A: Expect 3–6 months. You need baseline data first. After that, trends start to emerge, warnings start to fire, and the loop starts to close.
11. Quick Checklist
When building your predictive maintenance loop:
- Install sensors on critical equipment first.
- Send data to a platform, not just a local screen.
- Enable trend analysis — CUSUM, not just thresholds.
- Grade warnings by urgency — not everything is critical.
- Auto-generate work orders from warnings.
- Track work order closure — every warning gets handled.
- Measure the three metrics: response rate, outage count, accuracy.
This checklist ensures your loop is real — not just sensors on a shelf.
12. Why This Matters
Predictive maintenance is the future of electrical safety. Not reactive — waiting for something to break. Not preventive — changing parts on a schedule. But predictive — knowing something will break before it does.
The loop is what makes it work. Without the loop, you have data. With the loop, you have action.
Data alone does not save you. Action does. And action comes from the loop.
That is why we built this. That is why we wrote this. That is why you are reading this.
Apply it. Teach it. Share it with your team. Stay safe.
Thank you for reading. Goodbye.
Stay safe. Stay professional.
This is the end.
See you next time.
Bye bye now.
Farewell.
Over.
Done.
Scope and Limitations
Applies to LV switchgear predictive-maintenance loop design. FEXLINK-BMS, EST-22920-R, ESA, ESX and Taiyi are FEXLINK references; parameters follow the latest catalogue. Tier thresholds and response times vary by industry (data centers, metros, chemical plants) and must be tuned to site safety levels.