 微物联研究院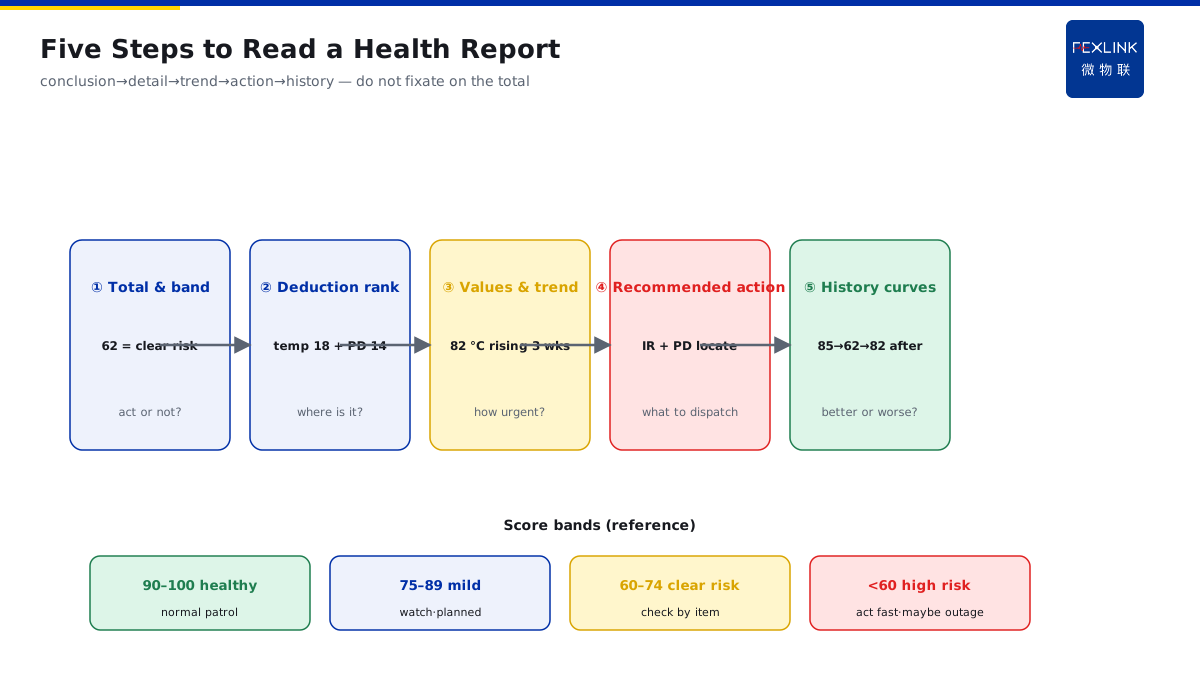
Direct Answer
The platform reports equipment health 62/100 — where does the score come from and what does it mean? The answer: health score = 100 − the sum of per-category deductions; deductions come from monitored indicators like temperature trend, leakage level, partial-discharge state, and operation count. To read the report, find the two or three largest deduction items — they point to the real weak spots. The total score is only the entry point; the per-category deductions are what drive maintenance dispatching.
At a campus, a 10 kV switchgear scored 62. The engineer reported to the supervisor, who asked: "Where does 62 come from? What's the problem?" — saying "health is low" in isolation explains nothing. Breaking it down: temperature trend −18 (contact at 82 °C rising for 3 weeks), partial discharge −14 (TEV 38 dB, moderate), operation count −6 (over 5,000 trips), other categories fine. The two largest deductions = temperature and PD — pointing to contact heating + insulation risk. Dispatch: IR re-check of contacts, PD localization of the insulation defect. Findings: contact-spring pressure loss raised contact resistance; contacts replaced, temperature fell; PD localized to dirt on the busbar insulator, cleaned and gone. A total of 62 says nothing; the two largest deductions gave the maintenance direction directly.
Because:
- The total is an entry, not a conclusion: 62 says "there is risk," not "where the risk is";
- Deduction items are the map: each indicator deducts by deviation (temperature, leakage, PD, operation count, etc.); large deductions = weak spots;
- Deduction ranking sets dispatch priority: fix the largest one or two first, others after;
- The 62-point action is not "repair the equipment" but "check the weak spots": dispatching by deduction items is how the score becomes useful.
Key insight: the health score is the checkup summary; the deductions are the checkup detail. The summary says "you have a problem"; the detail says where — both reporting and dispatching rely on the detail.
At a data center, a transformer's health fell from 85 to 68. A falling total is unsurprising; the mystery was "where did it drop." Breaking it down: leakage −20 (residual current from 120 mA to 300 mA), temperature −8 (oil normal), PD normal. The largest deduction = leakage — pointing to early insulation moisture/degradation. Dispatch: insulation re-test + PD localization confirmed cable-terminal moisture; after repair, leakage fell and health returned to 82. Watching only the total breeds anxiety; reading the deductions tells you to check leakage, not replace the transformer.
1. The Per-Category Structure of the Composite Score
The health score is not conjured; it has a clear per-category structure:
Typical categories (switchgear/transformers, etc.):
- Temperature trend: contact/busbar/winding temperature and rise rate — over-limit or persistent rise deducts;
- Leakage level: residual-current magnitude and trend — above baseline deducts;
- PD state: PD amplitude (pC/dB) and frequency — above threshold deducts;
- Operation count: breaker trip/close count, mechanism wear — near life limit deducts;
- Others: power quality (harmonics/unbalance), insulation-resistance trend, ambient temperature/humidity (platform-dependent).
Deduction logic:
- Each indicator has a "normal band" and a "deduction threshold";
- The further and longer the deviation, the more points deducted;
- Single-category deductions are capped (usually 20–30 points max, so one category cannot zero the total);
- Total = 100 − sum of deductions (or weighted, platform-dependent).
Number example (the 62 breakdown):
- Temperature trend: −18 (contact 82 °C rising 3 weeks);
- PD state: −14 (TEV 38 dB);
- Operation count: −6 (over 5,000 trips);
- Other categories: no deduction;
- Total = 100 − 18 − 14 − 6 = 62.
Key insight: the score is computed by subtraction — every deduction has a traceable source. If you cannot explain the score, you have not broken it down; break it down and the answer appears.
2. How to Rank the Major Deductions
Deductions are not uniform; the ranking itself is information:
Why ranking matters:
- The largest 1–2 deductions = current weakest spots (dispatch first);
- Mid-range deductions = latent risk (plan maintenance);
- No deduction = normal (leave it);
- Ranking tells you what to check first, not to recheck everything.
Engineering meaning of the ranking:
- Large deduction + rising trend = urgent (may worsen fast, e.g., temperature climbing);
- Large deduction + flat trend = watch (e.g., persistently high PD but stable — schedule);
- Multiple simultaneous deductions = overall aging (may need whole-equipment assessment, not one-point repair).
Common ranking readings:
- Temperature largest → check contact/busbar contact and load factor;
- PD largest → check insulation defects (insulators, cable heads, busbars);
- Leakage largest → check moisture / early insulation degradation;
- Operation count largest → check breaker mechanical life; evaluate replacement/overhaul.
Key insight: deduction ranking = dispatch priority. Do not spread effort evenly; dispatch the largest first and the score recovers fastest.
3. What a 62-Point Score Means for Action
The score is not "how many points = how much repair"; it is "what action corresponds":
Score bands (engineering reference):
- 90–100: healthy, normal patrol;
- 75–89: mild attention, monitor trend, include in planned maintenance;
- 60–74 (e.g., 62): clear risk — dispatch checks by deduction item (IR / PD / insulation re-test);
- <60: high risk — act promptly, outage maintenance if necessary.
Standard actions at 62:
- Break down the categories; find the largest 1–2 deductions;
- Dispatch by weak spot: temperature → IR re-check of contacts; PD → PD localization; leakage → insulation re-test;
- Verify then fix: replace contacts / clean insulation / treat moisture;
- Watch the score recover for 1–2 weeks after, confirming resolution.
Cautions:
- The score mixes lagging and predictive signals — temperature/leakage deductions reflect events that already happened; PD deductions reflect early defects (predictive);
- In the 60–74 band, do not "wait until it drops below 60" — the deduction items already point the direction; early checks cost less;
- Recovery does not equal immediate all-clear: observe one more cycle after treatment.
Key insight: 62 is not "wait a bit"; it is "go check the deduction items." The band gives the level; the items give the direction — together they complete the action.
4. Using Total and Categories Together
The total and the categories each have their use; only together are they complete:
What the total does:
- Macro health trend: the score curve shows the equipment's overall direction;
- Cross-equipment comparison: rank many devices and find "the worst one";
- Reporting: explain "overall equipment status" to management.
What the categories do:
- Localize weak spots: whichever item deducts most, the problem is there;
- Dispatch basis: maintenance orders are written per deduction item;
- Trend tracking: an item's deduction curve shows improvement or worsening.
Three steps of combined decision-making:
- Total → "do we need to act?" (band);
- Categories → "act on what?" (deduction ranking);
- Category trends → "how urgently?" (urgent or planned).
Counter-examples:
- Total only: 62, anxious but no idea what to do;
- Categories only: temperature −18, but no sense of overall severity;
- Both: 62 (clear risk) + temperature/PD largest → dispatch to check contacts and insulation.
Key insight: the total answers "is there a problem"; the categories answer "where." One line for reporting, item by item for dispatch — not contradictory, upstream and downstream.
5. How to Read a Health Report in Order
When you get a health report, read in order; do not be led astray by the total:
Step 1: total and band — is there risk? (62 → clear risk); Step 2: deduction ranking — what are the two largest? (temperature 18 + PD 14); Step 3: values and trends of the deducted items — 82 °C rising 3 weeks (urgency); Step 4: recommended actions — dispatch by weak spot (IR re-check, PD localization); Step 5: history curves — how score and items have moved (improving or worsening).
Why this order:
- Total gives the conclusion frame, deductions the problem list, trends the urgency, recommendations the actions;
- Read in order and reporting, dispatching, and follow-up flow in one pass;
- Skipping (total only) is the source of "score anxiety."
Key insight: the report is structured conclusion → detail → action. Read in order and "what do I do with 62" naturally becomes "check contacts and insulation" — the score is the entry, not the destination.
6. Product Landing: Online Interpretation of Health Deductions
FEXLINK's Predictive-Maintenance Solution turns "health-score breakdown" into online capability:
- The platform computes the health total and shows per-category deduction details — every deduction clicks through to the raw data;
- Deduction items auto-rank, with weak-spot Top hints: the largest item auto-links to the corresponding equipment part;
- Trend linkage: a deducted item climbing consecutively auto-escalates the alert (from "watch" to "verify");
- Dispatch support: auto-generates a maintenance-suggestion order per deduction item (IR re-check / PD localization / insulation test);
- Post-treatment comparison: deduction before/after shown side by side to verify the fix;
- Connected to the Digital Electrical Intelligent Supervision System, health, items, trends, and work orders share one dashboard.
Design principle in one sentence: turn "62 health score, can't explain" into "deduction items dispatch directly." The total concludes; the items direct — the platform turns the score into actions.
7. Common On-Site Mistakes
- Reporting only the total: reporting 62, unable to answer "where's the problem." Consequence: cannot explain, cannot dispatch. Correct: break down deductions before reporting.
- Spreading checks evenly: rechecking every category. Consequence: high cost, focus buried. Correct: the largest 1–2 deductions first.
- "Major overhaul" at a low score: scheduling full overhaul for 62. Consequence: over-maintenance. Correct: targeted treatment by deduction item.
- Not reviewing categories after repair: watching only the total recover. Consequence: missing the second-weakest unresolved item. Correct: confirm each item's deduction falls after treatment.
- Ignoring deduction trends: temperature −18 but "not over limit yet." Consequence: a persistent climb becomes a fault. Correct: deductions + trend together; rising = urgent.
Scope and Limitations
This article discusses breaking down and reading composite health scores for electrical equipment such as switchgear and transformers connected to a predictive-maintenance platform. Exact categories, weights, and deduction thresholds follow the platform's algorithm and equipment type; the score bands and values here are engineering references. Health is a data-driven state assessment, not a statutory inspection or equipment appraisal; on-site work must still follow procedures. All cases are anonymized (a certain campus / data center) and do not refer to any specific customer.